
Illustrations
Pie Chart Illustrations
Browse 69,000+ pie chart stock illustrations and vector graphics available royalty-free, or search for pie chart infographic or 3d pie chart to find more great stock images and vector art.
Related searches:
pie chart infographic3d pie chartinfographicpie chart iconbar graphfood pie chartisometric pie chartpie chart 5circle pie chartpie chart illustrationpie chart peoplevector pie chartpie chart 4pie chart 4 sectionspeople pie charthand drawn pie chartabstract pie chartdonut pie chartpie chart 8pie chart graphicmoney pie chartpie chart piecesmodern pie chartpie chart infographic vectorpizza pie chartcake pie chartpie chart with textpie chart 7pie chart abstract3 pie chart

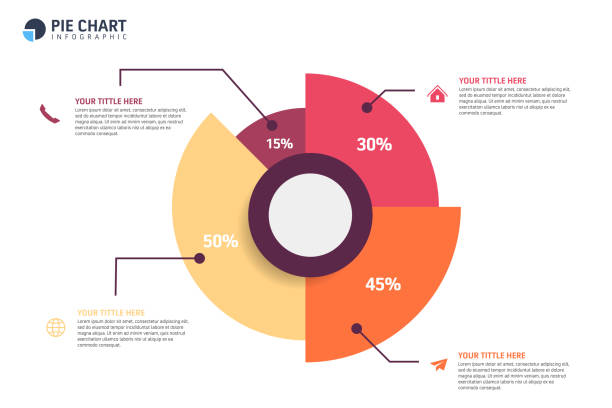
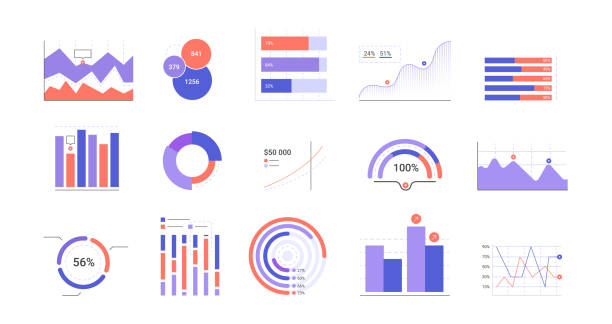

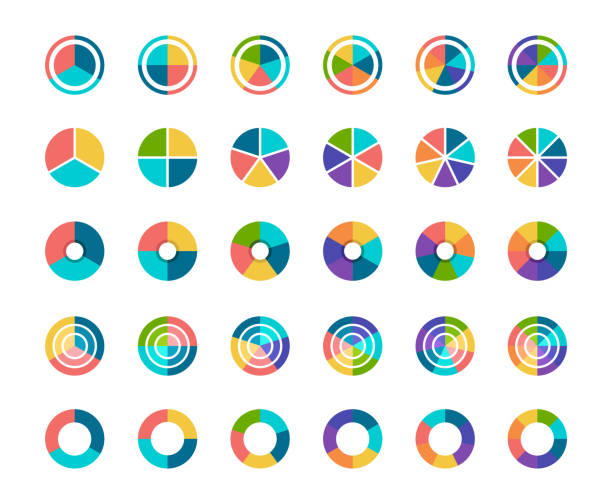
Pie chart set. Colorful diagram collection with 2,3,4,5,6 sections or steps. Circle icons for infographic, UI, web design, business presentation. Vector illustration.

Circle progress bar set with percentage text from 0 to 100 percent. Turquoise blue, light grey. Infographic, web design, user interface. Flat design. Vector illustration, no transparency, no gradients


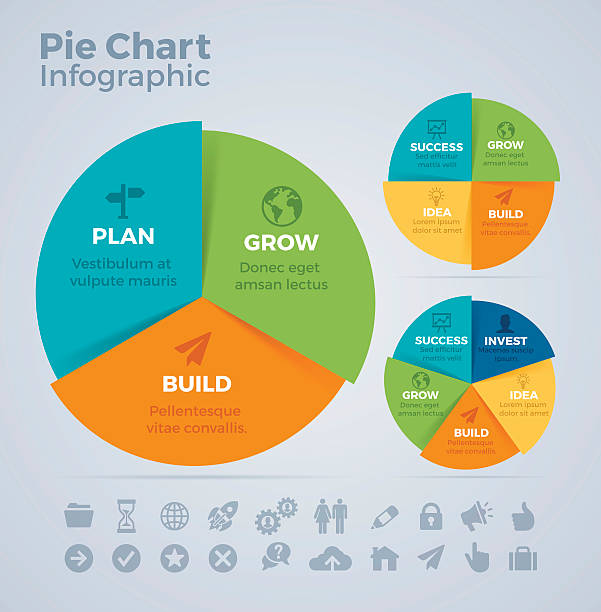
Pie chart infographic concept with space for your copy. EPS 10 file. Transparency effects used on highlight elements.

segmented pie chart design set, graph, division, slice, element, factor


Infographic Elements Line Icons. Pixel perfect. Editable stroke. Vector illustration.

Circle division infographic icon set. Pie chart divided 4,5,6 equal parts. Color pizza or donut round diagram. Infographic wheel segment and fraction. Vector illustration isolated on white background.


This modern and minimalistic vector illustration features a clean progress char. The main focus is a circular progress bar that visually represents the percentage completion. Next to the circle is a grid of small icons, enhancing the data visualization. The design is sleek, using blue and light gray tones, making it perfect for business presentations, reports, or dashboards that need to show progress, success rates, or performance metrics.This vector graphic is versatile and can be applied in various professional contexts such as project management, business analytics, or statistical reports. The clear and precise design ensures that the data is easy to understand and visually appealing, making it ideal for corporate use or digital marketing materials.Keywords: progress chart, percentage indicator, circular design, vector, data visualization, business, statistics, performance, metrics, sleek, modern, professional, blue, minimalistic, dashboard, project management, analytics, reporting, success rate
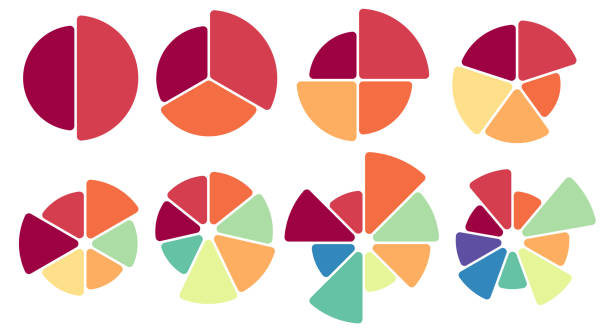
These multicolored circular charts are perfect for creating infographics and visualizing data in various presentations and documents. Each chart is designed in a vector format, allowing for high customization without loss of quality, whether used in print or on the web. The illustrations feature a variety of color combinations and segments, ideal for displaying statistical data, processes, or data analysis in business, educational, or marketing materials. The circular diagrams are stylized to be both visually appealing and easy to understand, enhancing the clarity of information presentation. They are especially useful for representing proportional relationships between parts of a whole, such as showing percentage shares, market analysis, resource distribution, and many other applications. With their broad color spectrum and simple design, these charts integrate seamlessly into various projects, providing visual consistency and a professional look.circular charts, infographics, data visualization, vector illustration, diagram, proportion, data analysis, business presentation, marketing materials, visual presentation.Download customizable vector circular charts for infographics and data visualization, ideal for business, educational, and marketing presentations.

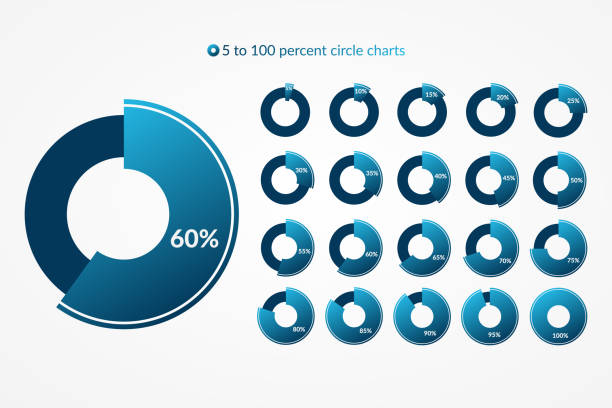
Set of circle percentage diagrams from 0 to 100. For web design, UI. Infographic - indicator with blue color. Circle chart infographic with percents
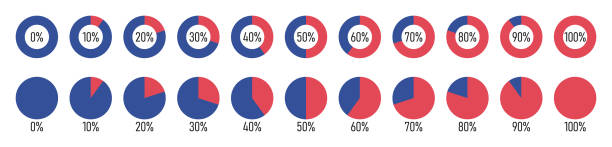
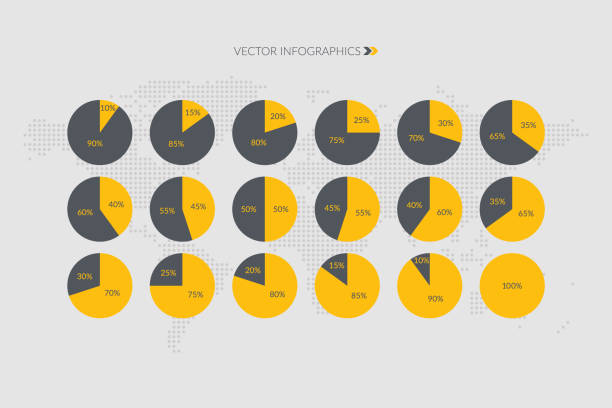
Pie chart percentage set. Round diagram with 10,20,30,40,50,60,70,80,90,100 sections or steps. Round graphs divided into sectors or pieces with percentage. Process cycle icons for infographics. Vector
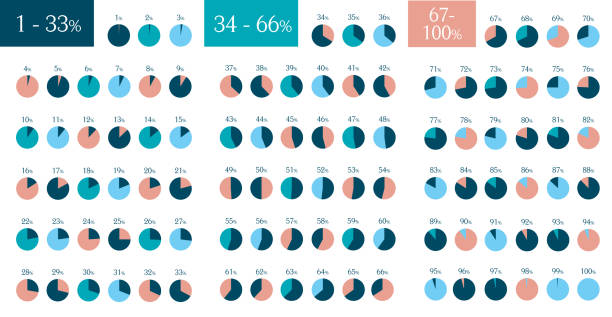
Mega Set of infographic percentage circle pie charts. 1 % to 100 %. Vector isolated elements.

Circle pie chart. 2,3,4,5,6,7,8,9,10 11 12 sections or steps Flat process cycle Progress sectors
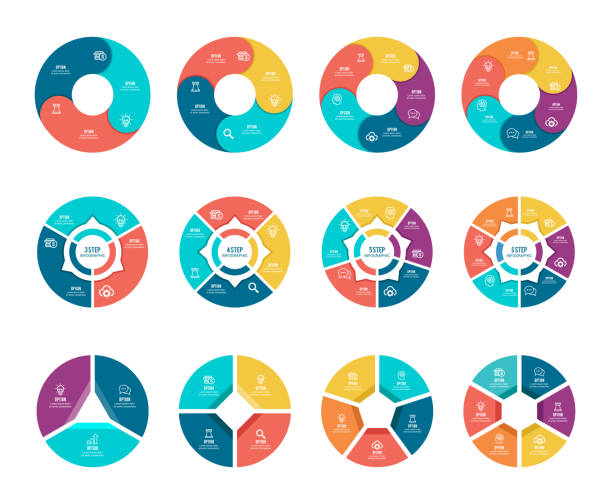
Vector illustration of the infographic elements, circle diagram.
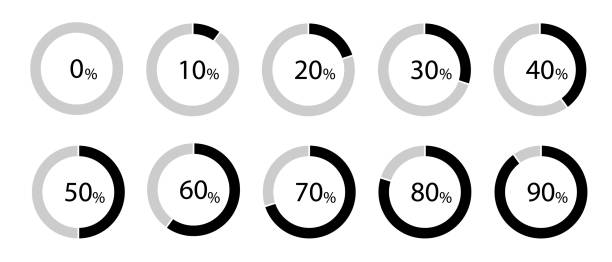


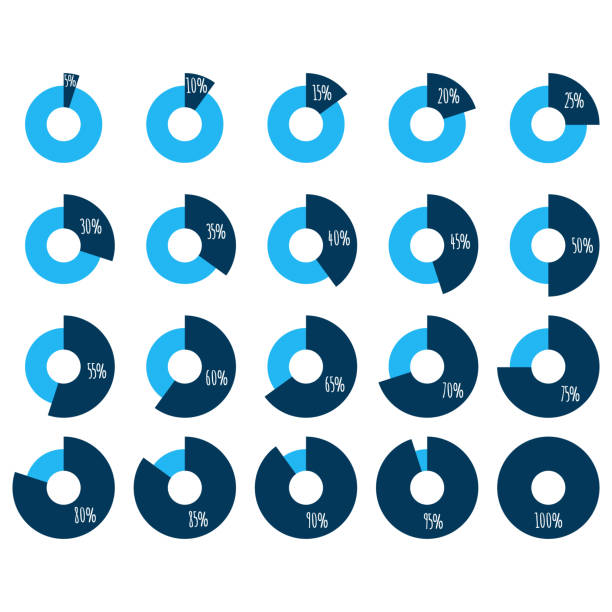
Percentage data charts perfect for infographics. 5%, 10%, 15%, 20%, 25%, 30%, 35%, 40%, 45%, 50%, 55%, 60%, 65%, 70%, 75%, 80%, 85%, 90% 95%, 100%.
Segment slice set. Pie chart color icons. Circle section graph. 1,20,19,18,16,9 segment infographic. Wheel round diagram part. Three phase, six circular cycle. Geometric element. Vector illustration.

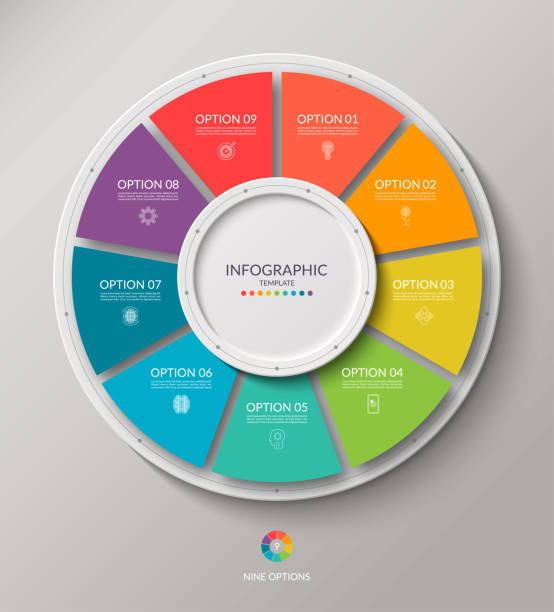
Pie chart graphic spinner infographic template concept with space for your copy. EPS 10 file. Transparency effects used on highlight elements.
Vector line icon set appropriate for web and print applications. Designed in 48 x 48 pixel square with 2px editable stroke. Pixel perfect.

Pie chart 3D modern shape design element infographic
Vector illustration colorful pie chart collection with 3,4,5,6 and 7,8 sections or steps


Vector color flat chart diagram icon illustration set. Red and blue diagram collection of pie, donut, radial bar and polar area infographic element. Design for finance, statistics, analytics, science.

Pie chart color icons. Segment slice set. Circle section graph. 1,20,19,18,16,9 segment infographic. Wheel round diagram part. Three phase, six circular cycle. Geometric element. Vector illustration.

Technology data analytics statistics pie chart abstract background.


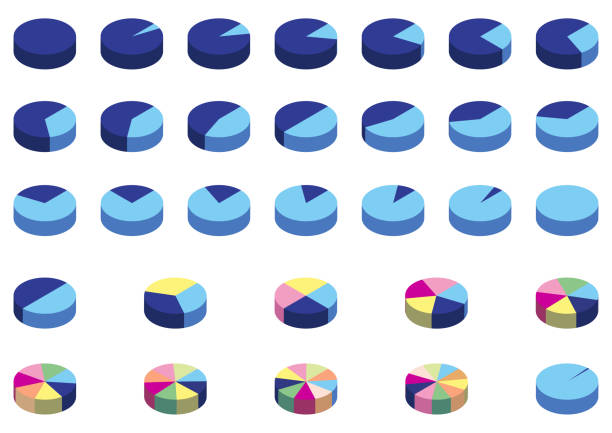
This is Isometric 3D PieChart Infographics.You can used it all of your business purposes. You can change all the elements in your own choice by one click.
Simple vector line Icons. Editable stroke. Pixel perfect.


Set of percentage diagrams with scale from 1 to 100 percent. Pie chart of percentages for infographic, user interface. Progress, download and upload, count meter with scale from 1 to 100. Vector
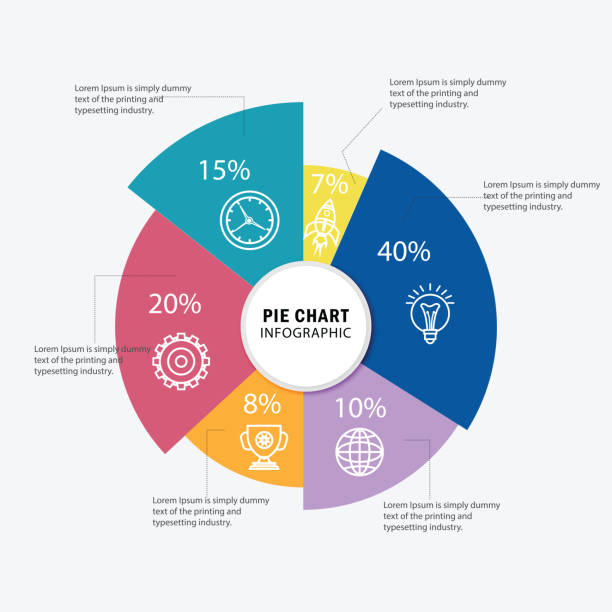
USA, India,2021,Pie Chart, Steps, Data, Banking, Infographic, Number 6
Vector circle chart design, modern template for creating infographics, presentations, reports, visualizations. Global swatches.
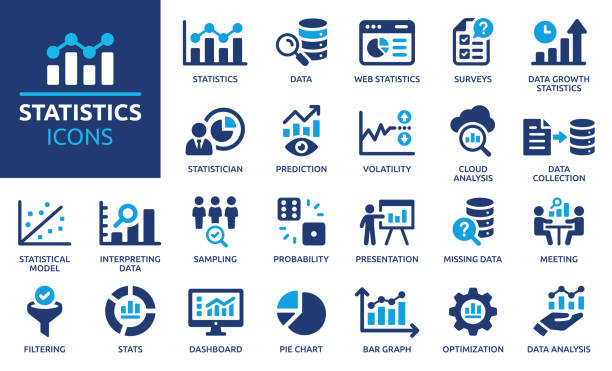
Containing data, web statistics, survey, prediction, presentation, cloud analysis and pie chart icons.
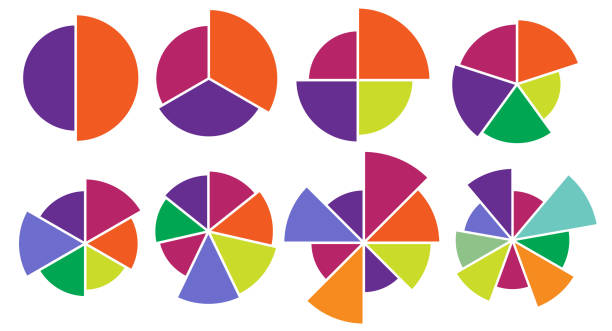
Cycle diagram set. Circle icons for infographic, UI, web design, business presentation. Vector illustration.

Modern pie chart line icon. Premium pictogram isolated on a white background. Vector illustration. Stroke high quality symbol. Pie chart icon in modern line style.

Pie chart set. Colorful diagram collection with 2,3,4,5,6 sections or steps. Circle icons for infographic, UI, web design, business presentation. Vector illustration.

Wheel round diagram part symbol. Pie chart color icons. Segment slice sign. Circle section graph. 10,2,4,5 segment infographic. Three phase, six circular cycle. Geometric element. Vector illustration.

Pie chart color icons. Segment slice sign. Circle section graph. 1,20,19,18,16,9 segment infographic. Wheel round diagram part. Three phase, six circular cycle. Geometric element. Vector illustration.



of100Next