Stock market investment data and analysis finance graph. Business financial chart with moving up arrow graph
Browse 421,600+ trading stock illustrations and vector graphics available royalty-free, or search for stock trading or trading desk to find more great stock images and vector art.
Stock market investment data and analysis finance graph. Business financial chart with moving up arrow graph

Business financial chart with moving up arrow graph.Stock market investment data and analysis finance graph.

Investment finance chart,stock market business and exchange financial growth graph.Trade analytics line graphs and financial chart investment.Financial investment graphs.

Business growth concept art collage. Halftone hands of colleagues holding rising arrow chart. Teamwork, work efficiency, partnership concept. Trendy modern retro vector illustration

Abstract infographic visualization. Financial chart with uptrend line graphs and candlesticks. Futuristic network or business analytics. Graphic concept for your design.

Digital analytics data visualization, financial schedule, monitor screen in perspective for presentations

Financial investment volatility, up and down arrows profit graph due to Coronavirus crisis, businessman trying to balance like a tightrope walker so that volatility does not gobble up his investments

Editable Stroke - Fiscal Year - Line Icons

Business growth graph chart and success financial arrow up. Development graph profit and investment

Business candle stick graph chart of stock market investment trading, Bullish point, Bearish point. trend of graph vector design. stock illustration
Vector illustration in modern thin line style of progress icons: success, increase, evolution, and other. Pictograms and infographics for mobile apps.

Illustration contains a transparency blends/gradients. Additional .aiCS6 included. EPS 10

Stock market investment trading graph growth.Investment finance chart,stock market business and exchange financial growth graph

Broker report economics texture for globe business concept.
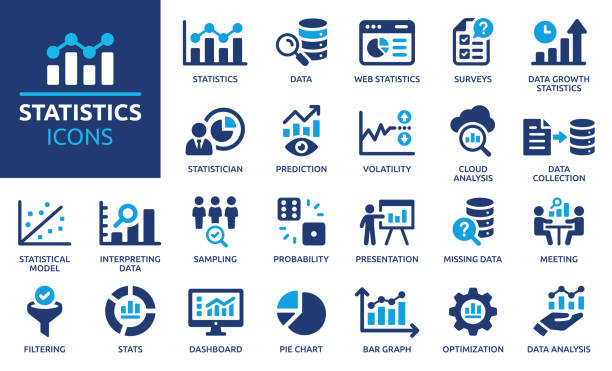
Containing data, web statistics, survey, prediction, presentation, cloud analysis and pie chart icons.

Vector illustration in modern thin line style of business infographic related icons: donut chart, diagram, arrows, and more. Pictograms and infographics for mobile apps

Sophisticated trading dashboard designed for tracking and managing investments across various financial markets, including stocks, cryptocurrencies, indices, ETFs, and commodities

Business financial chart with moving up arrow graph. Stock market investment data and analysis finance graph and market chart investment

Financial asset cryptocurrency growth stocks mutual fund value increasing abstract background pattern.

Abstract blue growing financial graph chart background. Vector dotted lines tech design
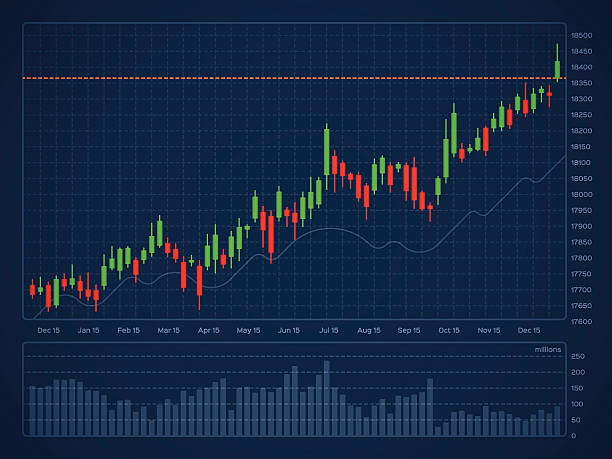
Candlestick chart financial chart used to illustrate price movements of a security, derivative, or currency showing open, close, high price and low price for each day over a specified period of time. EPS 10 file. Transparency effects used on highlight elements.

Stock exchange. Buy and sell indicators for trade on the chart. Financial diagram with assets values moving up and down. Vector illustration.

Finance background illustration with abstract stock market information and charts over world map and stock indexes. stock illustration

Abstract infographic visualization. Financial chart with uptrend line graphs and candlesticks. Futuristic network or business analytics. Graphic concept for your design.

Stock market candlestick financial growth chart.

Financial asset cryptocurrency growth stocks mutual fund value decreasing losing value dropping red abstract background pattern.

Modern background design with abstract graphs and textures. Fully editable vector.

Vector line icon set appropriate for web and print applications. Designed in 48 x 48 pixel square with 2px editable stroke. Pixel perfect.
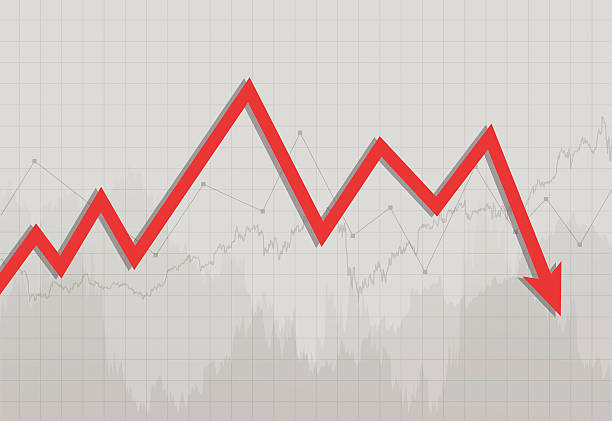
Illustration contains a transparency blends/gradients. Additional .aiCS6 file included. EPS 10

Blue arrows moving up to indicate stock market growth

Chart of investment financial data with glowing globe. Modern technology background. World stock market investment trading graph. Business concept. Vector illustration. EPS 10

Abstract infographic visualization. Financial chart with uptrend line graphs and candlesticks. Futuristic network or business analytics. Graphic concept for your design.

Banking Line Series. Pixel Perfect - Editable Stroke - 32 Pixel width

Stock exchange chart graph on american flag background
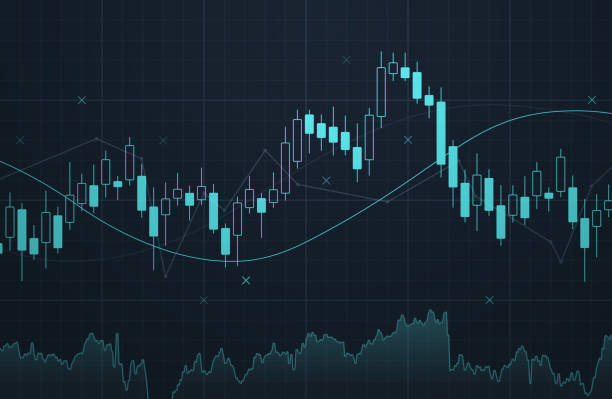
Stocks buying and selling of commodities or cryptocurrency value chart with space for your copy.