Bar Graph Pictures, Images and Stock Photos
Browse 93,500+ bar graph stock photos and images available, or search for bar chart infographic or 3d bar chart to find more great stock photos and pictures.
bar chart infographic
3d bar chart
bar graph icon
line graph
pie chart
bar graph infographic
3d bar graph
horizontal bar graph
bar graph abstract
isometric bar graph
stacked bar graph
bar graph template
hand drawn bar graph
bar graph increase
money bar graph
bar graph design
bar graph growth
bar graph background
rising bar graph
growth bar graph
bar graph up
bar graph concept
digital bar graph
circle bar graph
bar graph icon vector
financial bar graph
vector bar graph
bar graph with arrow
bar graph chart
animated bar graph
Most popular
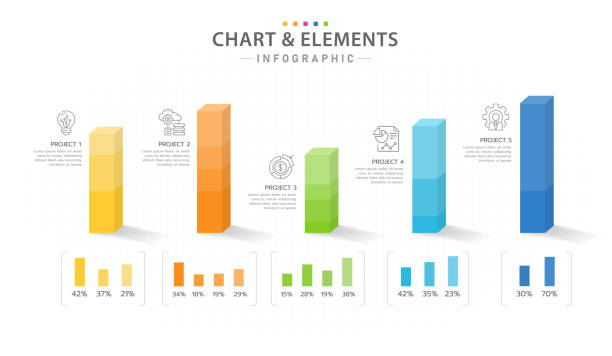
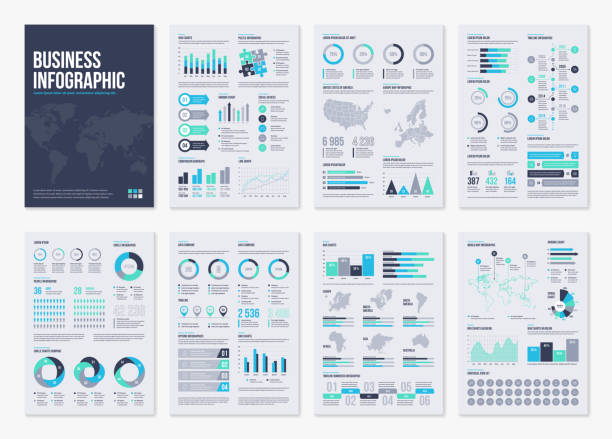
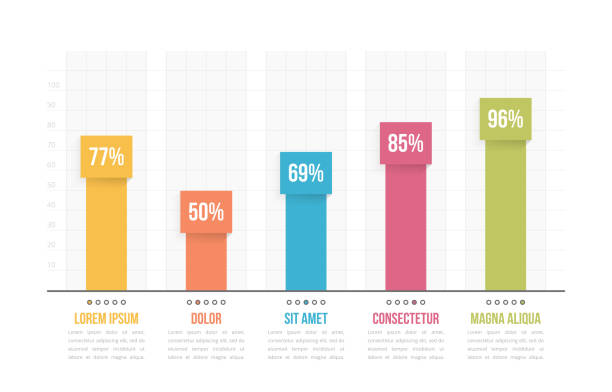
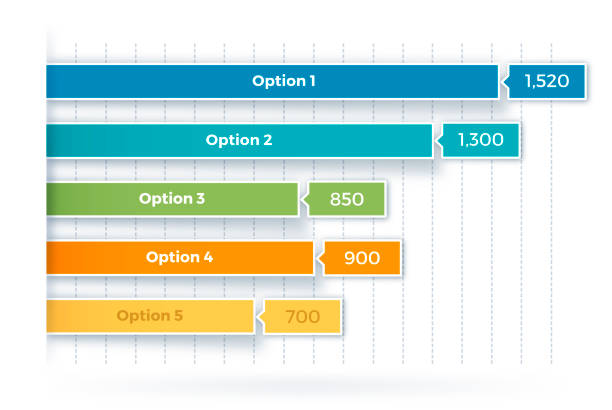
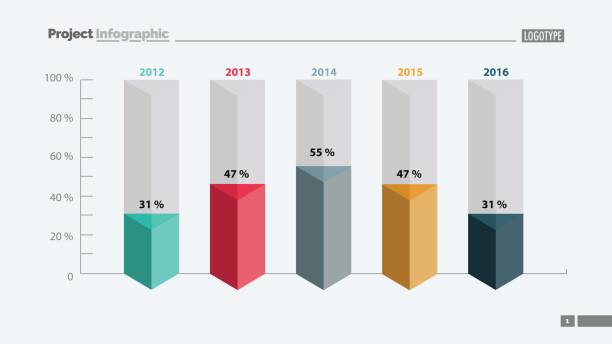
Colorful bar chart template with five elements, business infographics template, vector eps10 illustration
Infographic template for business project. 5 Steps 3D Bar Chart diagram with layered block levels, presentation vector infographic.

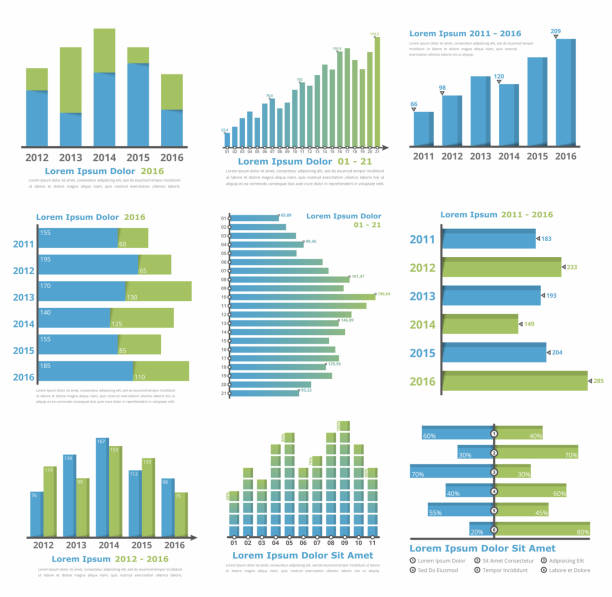
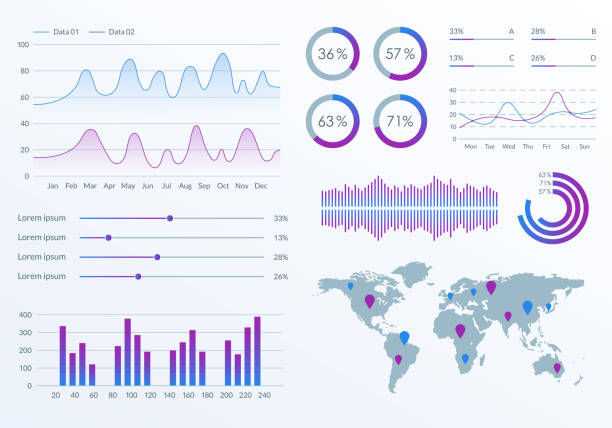
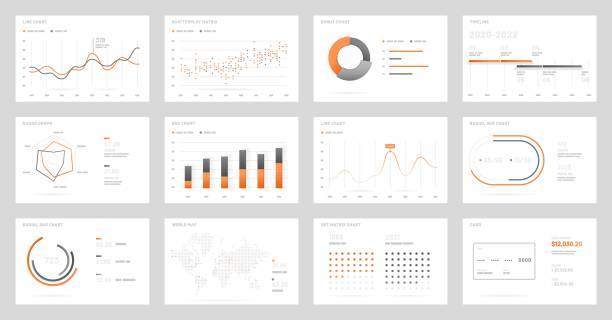
Graphs and charts templates for statistics or data visualization, set of 9 infographic templates for reports and presentations, vector eps10 illustration
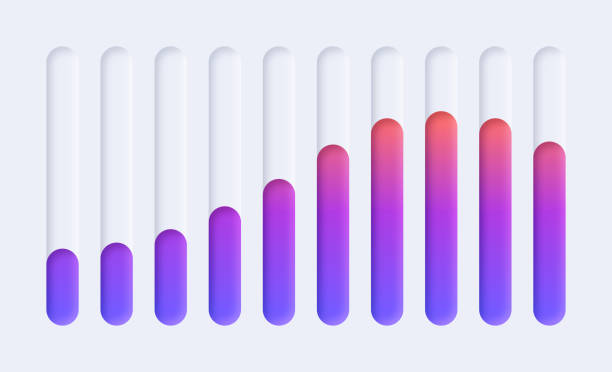
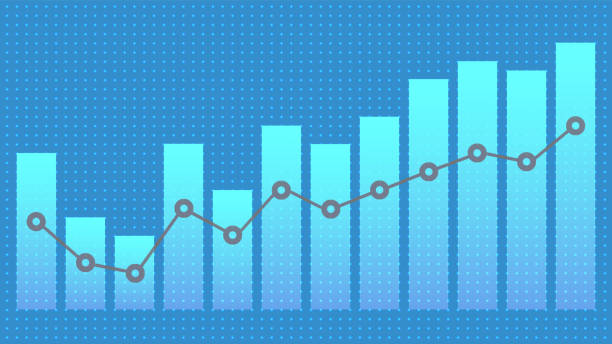
Neumorphism modern bar chart statistics gauges moving up design.
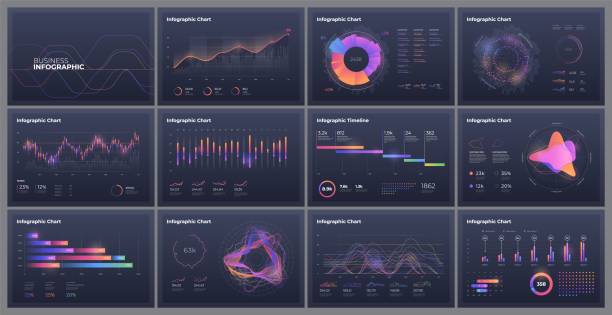
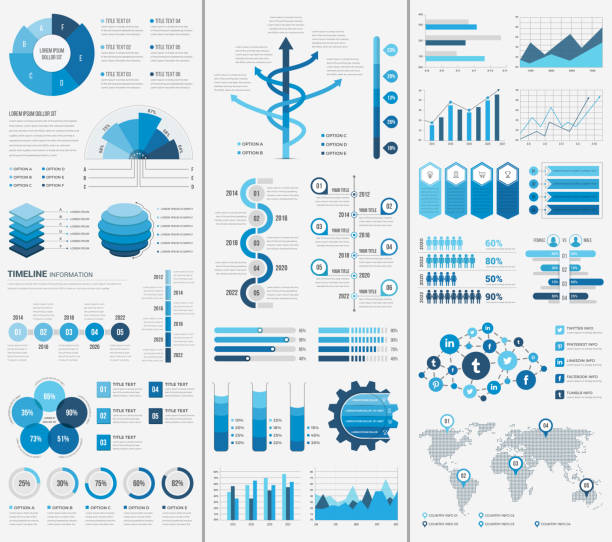
Infographic elements for business layout, presentation template, flyer, leaflet and corporate report. UI and UX Kit with big data visualization.


modern vector abstract bar chart infographic elements.can be used for workflow layout, diagram, number options, web design. illustration ,EPS10
Infographic template for business. Modern Timeline diagram calendar with annual comparison chart, presentation vector infographic.

Vector illustration of a bar chart drawn as an info graphic. This illustration contains transparency and gradient mesh effects. Therefore the file is am Illustrator EPS 10 file. The file has been set up using CMYK colours and no spot colours.
Infographic elements. Use in presentation template, flyer, leaflet and corporate report. UI and UX Kit with big data visualization.
Simple vector line Icons. Editable stroke. Pixel perfect.
Infographic brochure elements for business data visualization. Vector illustration in modern flat info graphic style.
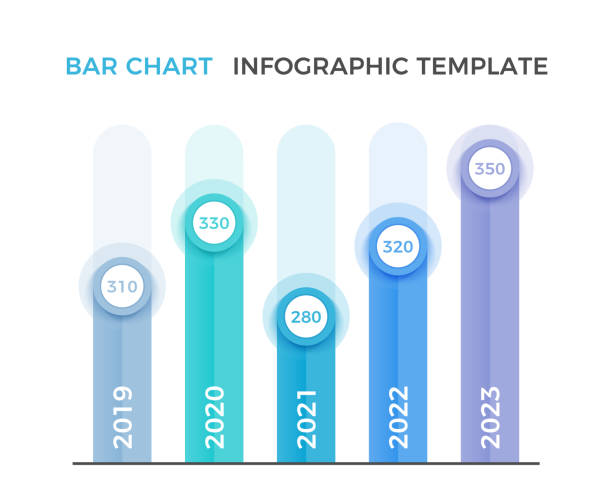
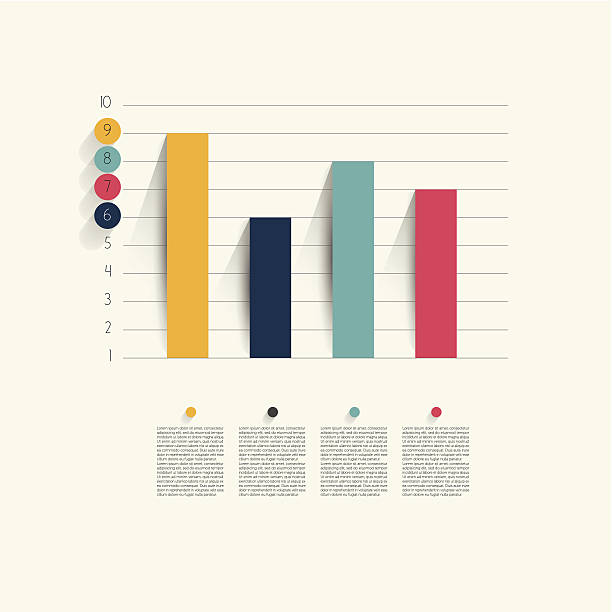
Bar graph template, business infographics, vector eps10 illustration

Dashboard, great design for any site purposes. Business infographic template. Vector flat illustration. Big data concept Dashboard

Bar graph and line graph templates, business infographics, vector eps10 illustration
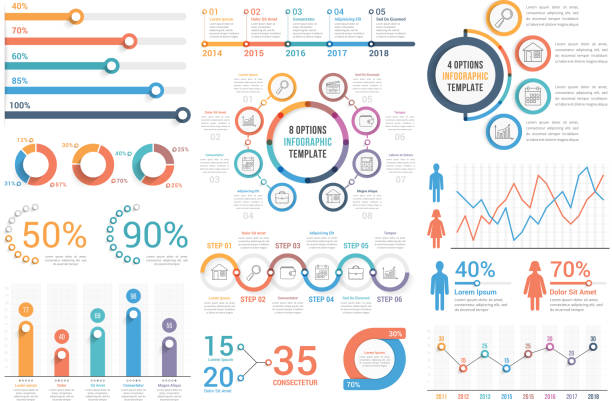
Infographic elements - bar and line charts, percents, pie charts, steps, options, timeline, people infographics, vector eps10 illustration
Vector line icon set appropriate for web and print applications. Designed in 48 x 48 pixel square with 2px editable stroke. Pixel perfect.
Dashboard infographic template with big data visualization. Pie charts, workflow, web design, UI elements.
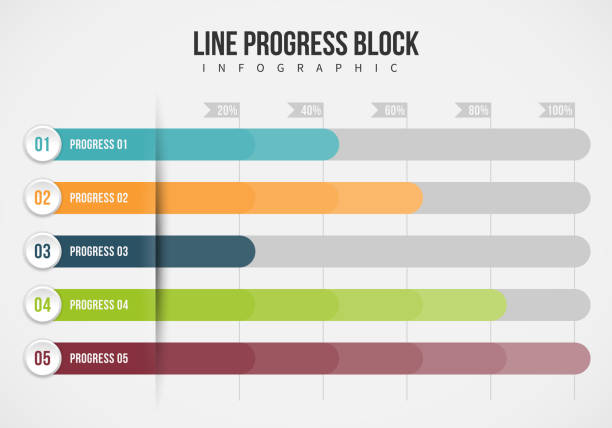
Vector illustration of line progress block infographic design element.
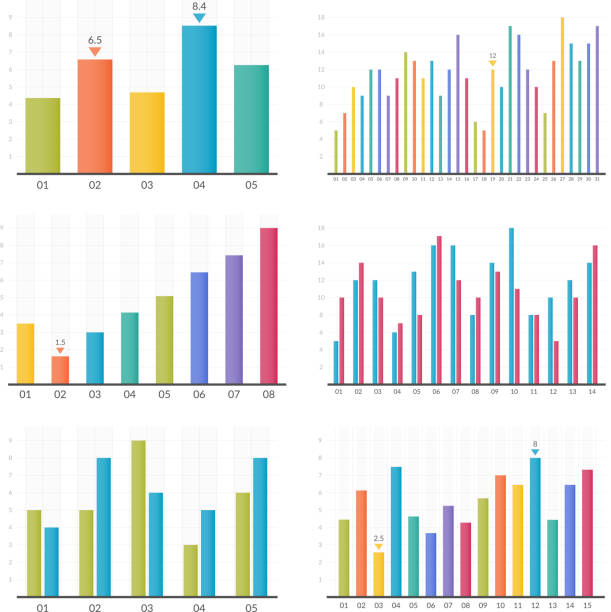
Colorful bar graphs, six different styles, vector eps10 illustration
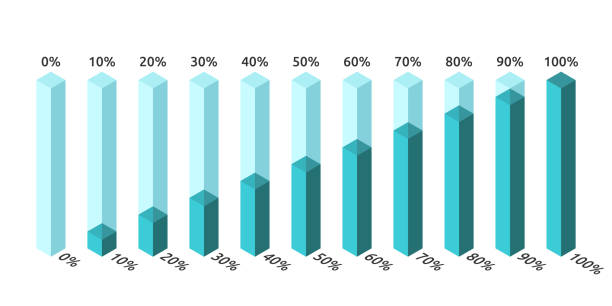
Isometric vertical progress bars, percentage indicators or charts set. Turquoise blue glass or water columns isolated on white. Flat design elements. EPS 8 vector illustration, no transparency
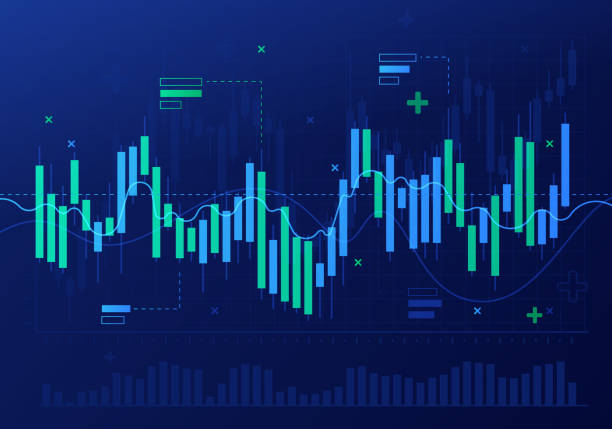
Stock market candlestick financial growth chart.
This is Infographic Elements. It can be used in almost every project.

3D infographic of increasing growth graph bar. Vector graphic design

Bar graph data concept with space for your copy.
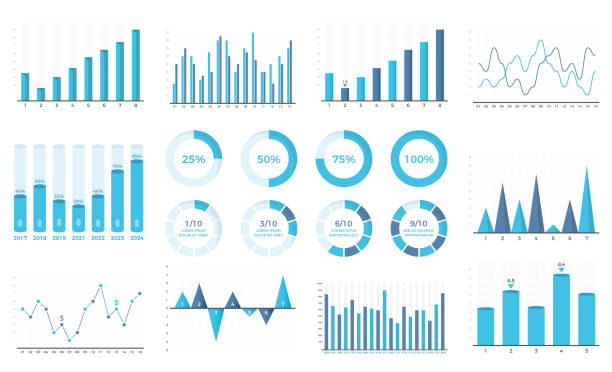
Set of bar graphs and line charts, circle progress indicators, vector eps10 illustration
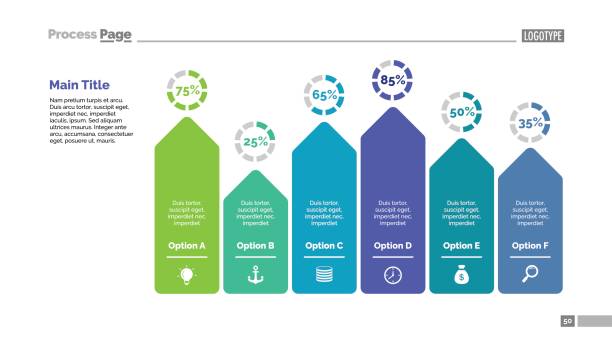
Six arrows bar chart slide template. Business data. Percent, diagram. Creative concept for infographic, presentation, report. Can be used for topics like analysis, accounting, finance.
30 Chart and Diagram Outline Icons.

abstract infographic template design with bar chart element
Modern modern infographic vector template with statistics graphs and finance charts. Diagram template and chart graph, graphic information visualization
Bar Chart Flat Icon.
Big set of infographic tools. Use in presentation templates, mobile app and corporate report. Dashboard UI with big data visualization.
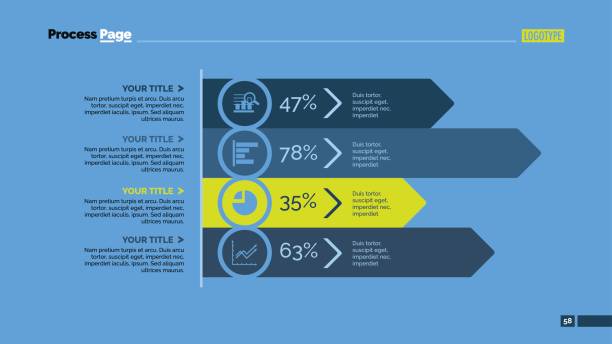
Four arrows bar chart. Business data. Horizontal, diagram. Concept for infographic, presentation, report. Can be used for topics like analysis, statistics, finance.
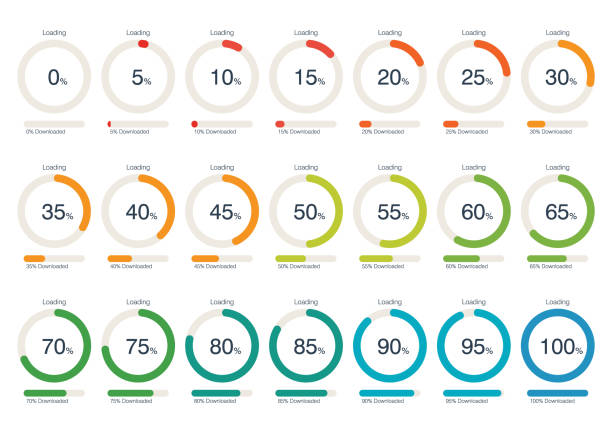
Circle Loading and Progress Bars Collection Set. Vector Illustration

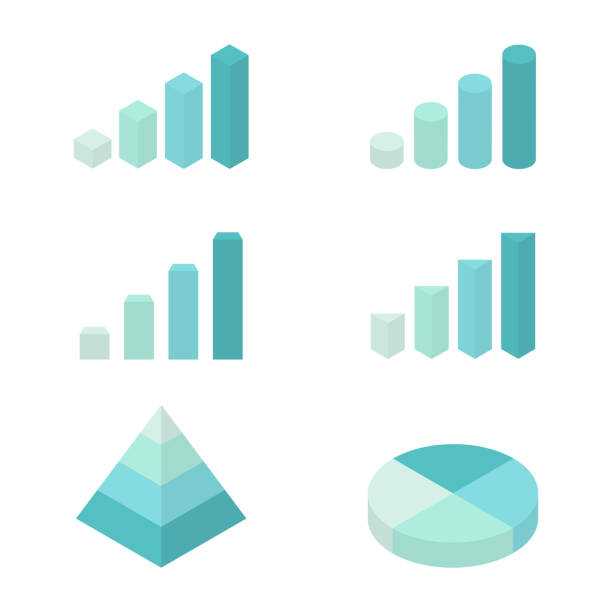
Business blue analysis symbols for reports and presentations. Isometric graph, pyramid and pie chart set. Big data concept. Infographic 3D elements collection. Vector illustration isolated
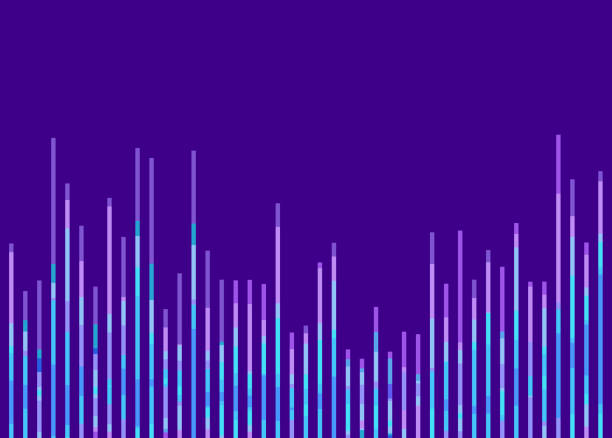
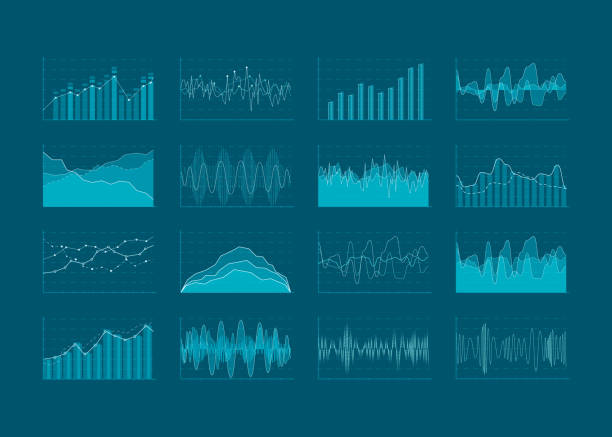
Science and data abstract tech background.
Five columns bar chart slide template. Business data. Percent, comparison. Creative concept for infographic, presentation, report. Can be used for topics like finance, analytics.

Vector flat design statistics vertical blue columns graph infographic template. Blue folded papers as columns in simple graph template
Set of infographic colorful elements: bar charts; statistics, circle charts, icons, presentation graphics
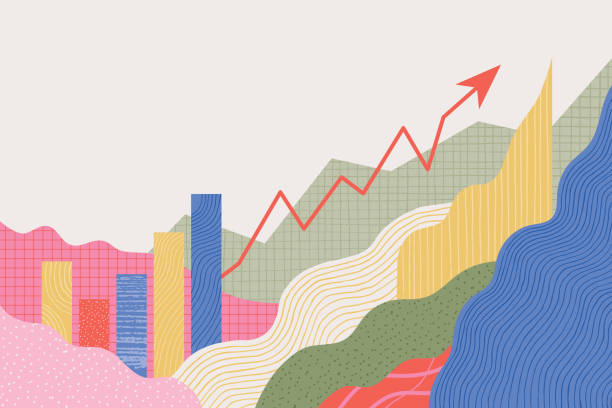
Economy, growth, chart, graph, rise, rising, up, exchange, financial, bar vector.
Abstract financial background with uptrend line, textured graphs, charts and copy space. Editable vectors on layers.
