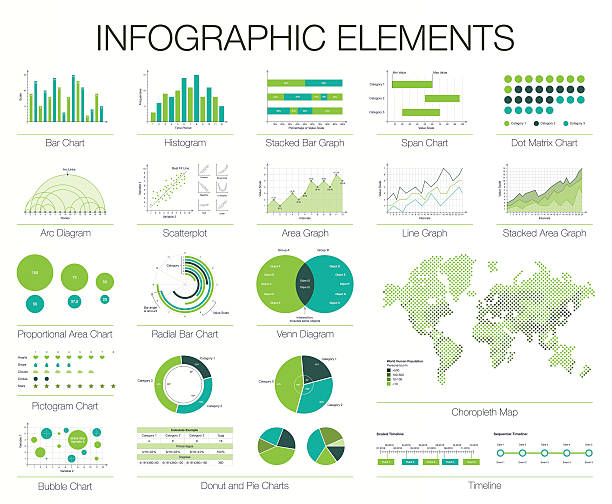
Infographics Template. Set of graphic design elements, histogram, arc and venn diagram, timeline, radial bar, pie charts, area, line graph. Vector choropleth world map
Browse 32,500+ arc diagram stock photos and images available, or start a new search to explore more stock photos and images.

Infographics Template. Set of graphic design elements, histogram, arc and venn diagram, timeline, radial bar, pie charts, area, line graph. Vector choropleth world map
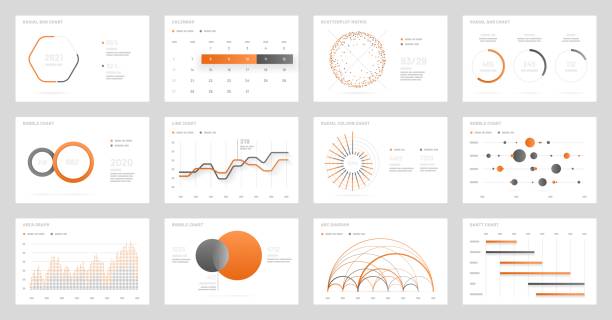
Big set of infographic tools. Use in presentation templates, mobile app and corporate report. Dashboard UI with big data visualization.
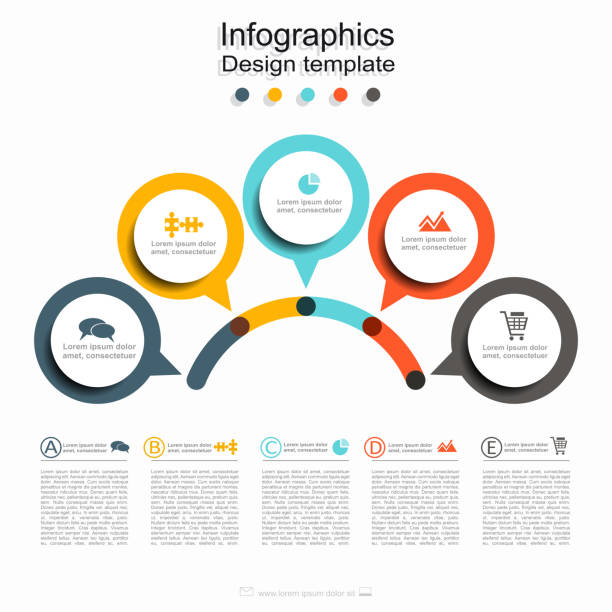
Infographic design template with place for your data. Vector illustration.
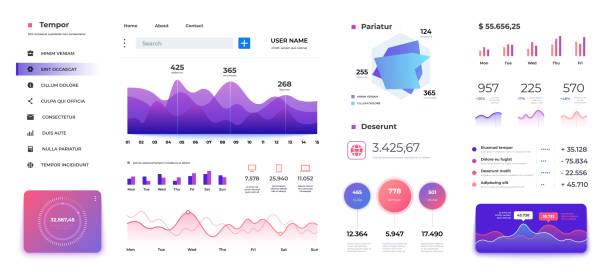
Infographic dashboard template. Admin panel ui, diagrams graphs and progress bars data statistics workflow. Vector modern screen interactive holographic charts

Graphs and Charts Icons, Symbol Collection, Vector Illustration.

Modern financial background design with bule and pink abstract graphs and textures.
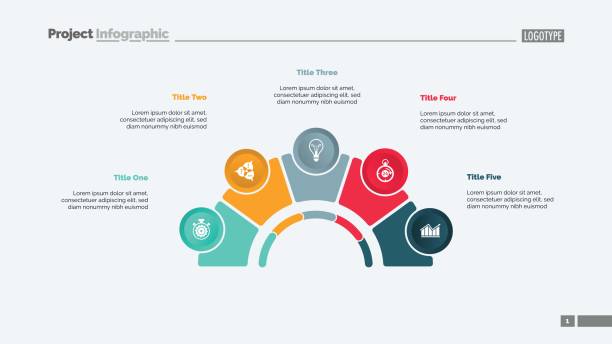
Process chart with five elements. Step diagram, pie chart, layout. Creative concept for infographics, presentation, project, report. Can be used for topics like strategy, planning.

Wireframe sound wave. Abstract motion lines. Graphic concept for your design
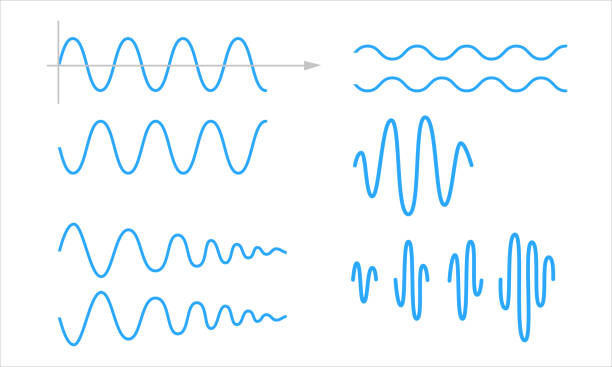
Sinusoid. A set of sinusoidal waves. Pulse linesisolated on a white background. Vector symbol

Wireframe sound wave. Abstract motion lines. Graphic concept for your design

Vector illustration of circle round line infographic design element.
Vector illustration of the infographic elements, circle diagram.

Technology data analytics statistics pie chart abstract blue background.
Vector illustration of the infographic elements. Fluid or liquid graphic graphic element design
3D digital colored wireframe landscape on white background. Sound waves abstract visualization. Concept of big data charts analysis and information technology. Vector illustration of sound waves flow.

Four step circle pathway direction circle curve infographic symbols.

Bar chart or wave stage diagram with 5 colorful columns, curved line, linear icons and place for text. Concept of business analytics visualization. Infographic design template. Vector illustration
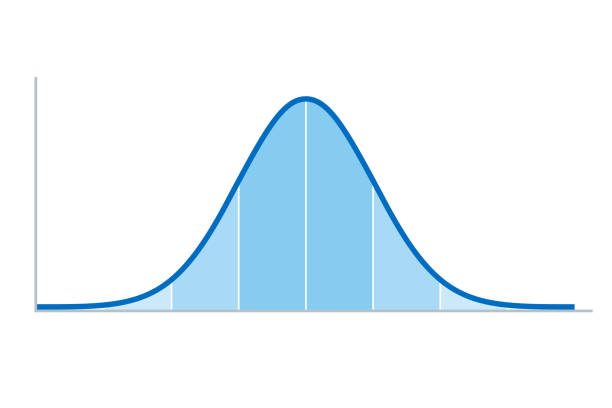
Gaussian distribution. Standard normal distribution, sometimes informally called a bell curve, used in probability theory and statistics. Standard deviation. Illustration on white background. Vector.

Dashboard, great design for any site purposes. Business infographic template. Vector flat illustration.

Set of rotating arrows. Arrows following a circle. Circular design elements. Circle infographic.

Menstrual cycle and pregnancy graphic. Hormones in the female body. Progesterone, prolactin, hCG, estradiol, oxytocin and cortisol in the woman body. FSH and LH medical chart flat vector illustration

Normal distribution, also Gaussian distribution or Bell curve. Very common in probability theory. The red curve shows the standard normal distribution. Illustration on white background.

Hand-drawn vector drawing of an Infographic regarding the Coronavirus, Flatten The Curve. Black-and-White sketch on a transparent background (.eps-file). Included files are EPS (v10) and Hi-Res JPG.

Thin line chart elements for infographic. Outline diagrams and linear graphs vector templates. Charts and diagrams for business report or presentation
Illustration set of curved arrows for business materials (monochrome)

Infographic shapes arrow direction progress process circles abstract design plan.

chart with red and green arrows on LCD screen, green one is pointing upwards, the red one is declining.

NOTE FOR REVIEWERS: This image is a 3D render and does NOT have a corresponding vector file
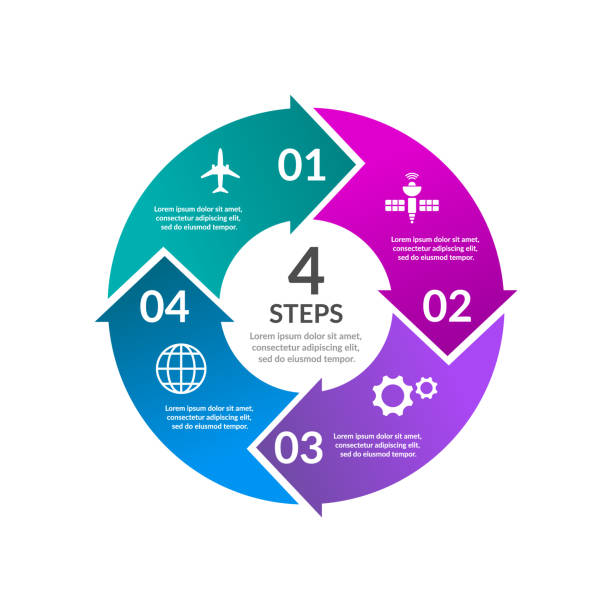
Cycle graph or chart. Business concept presentation template. Annual report layout. Process description. Vector illustration, flat.

Crowd from above forming a growth graph with lines connecting between them to show how th COVID-19 can expand
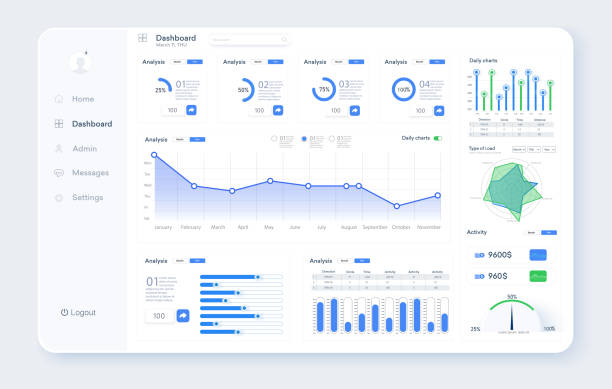
Dashboard UI, UX, KIT, great design for any site purposes. Business infographic template. Vector flat illustration.
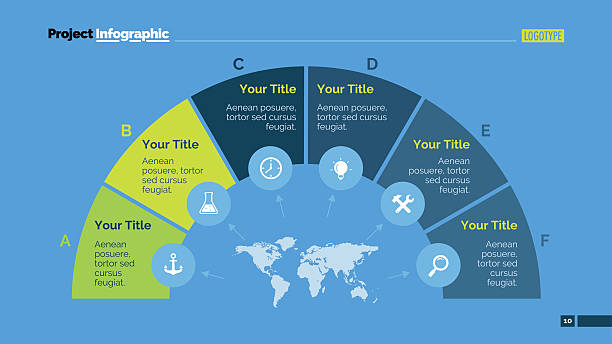
Editable template of presentation slide representing creative semicircle diagram with six steps, icons and world map
Simple set of diagram and graphs related vector icons for your design.

Abstract machine process working server system process gradient design line background.

Sound effects vector color illustrations
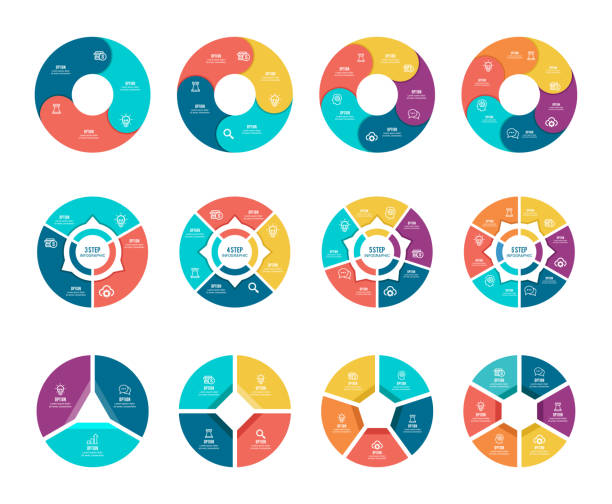
Vector illustration of the infographic elements, circle diagram.

Infographic Elements Line Icons. Pixel perfect. Editable stroke. Vector illustration.
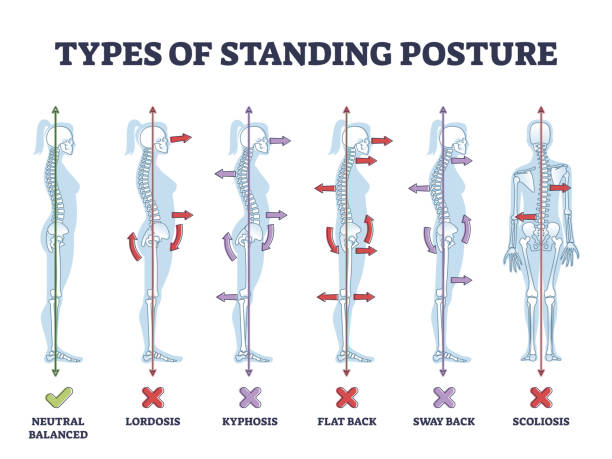
Types of standing postures and medical back pathology set outline diagram. Educational labeled collection with spine curvature problems compared to healthy neutral balanced example vector illustration
Connection network working together teamwork data infographic design template.

Process chart with three elements. Step diagram, pie chart, layout. Creative concept for infographics, presentation, project, report. Can be used for topics like strategy, planning.
Timeline infographic 6 milestone like a road. Business concept infographic template. Vector illustration.

Gauss distribution. Math probability theory. Standard normal distribution. Gaussian bell graph curve. Business and marketing concept. Vector illustration. EPS 10. Stock image.
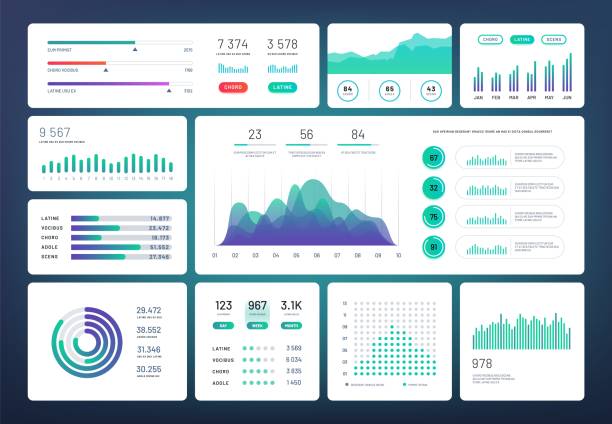
Infographic dashboard template. Simple green blue design of interface, admin panel with graphs, chart diagrams. Vector infographics. Interface panel admin, infographic data presentation, economic ui

Topographic map background concept with space for your copy. EPS 10 file. Transparency effects used on highlight elements.
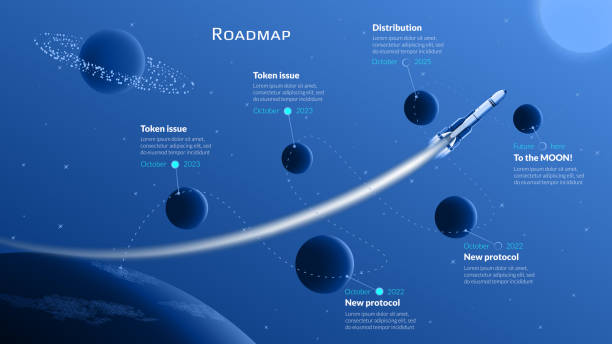
Roadmap with planet Earth and space rocket with long trail flying between planets to the Moon on blue background. Timeline infographic template for business presentation. Vector illustration.