
Images
Business Strategy Stock Photos
Browse 2,621,200+ business strategy stock photos and images available, or search for business plan or strategy to find more great stock photos and pictures.
Related searches:
business planstrategyplanningbusiness strategy iconsflat designbusiness strategy conceptbusiness strategy icondigital business strategybusiness strategy infographicbusiness strategy abstractsustainable business strategysmall business strategybusiness strategy planningbusiness strategy planbusiness strategy photosbusiness strategy teambusiness strategy illustrationbusiness strategy chessbusiness strategy vectorbusiness strategy covidbusiness strategy technologybusiness strategy discussionnew business strategybusiness strategy white backgroundvirtual business strategybusiness strategy peoplebusiness strategy collaborationbusiness strategy icon setbusiness strategy manbusiness strategy presentation


Woman in striped shirt working on tablet displaying colorful graphs and data analysis in a business environment.

Our creative library is free of AI-generated contentChoose your visuals with confidence knowing our creative library is free from AI-generated content, so your searches only return safe, high-quality visuals you can trust.

Key Performance Indicator (KPI) using Business Intelligence (BI) metrics to measure achievement versus planned target, person touching screen icon, success

Abstract people standing on a large digital screen, analysing interactive data visualisations and charts for strategic planning. Representing teamwork, technology, and data-driven decision making in a corporate environment.

Technology and financial advisory services concept. Business teamwork and working on digital laptop computer with advisor showing plan of investment to clients at table office. Digital marketing.

Two data analysts Working on data analysis dashboard for business strategy

Two business men meeting and looking at financial data, charts and graphs on a digital tablet and a laptop computer. There are documents and paperwork on the table. One man is pointing at the screen

KEY PERFORMANCE INDICATORS vector word cloud on sphere with title highlighted in blue


Trendy halftone collage. Concept of process implementation, work integration, Improve execution and optimize management. Application and activation of innovation in manufacturing business. Vector illustration for web banner, social media banner, marketing material. Vector illustration

Performance Management Editable Stroke Vector Icon Set. SWOT Analysis, KPI, Chart, Analyzing, Efficiency, Performance, Business Target



coworkers in a startup brainstorming strategies, writing a business plan on whiteboard to his team on a meeting

Abstract Data Chart - 3d rendered image. Machine learning concept. Analyzing Digital Data idea. Big data graph representation with flowing data blocks.

growth in business and finance, growing graphs and charts with statistics and digits
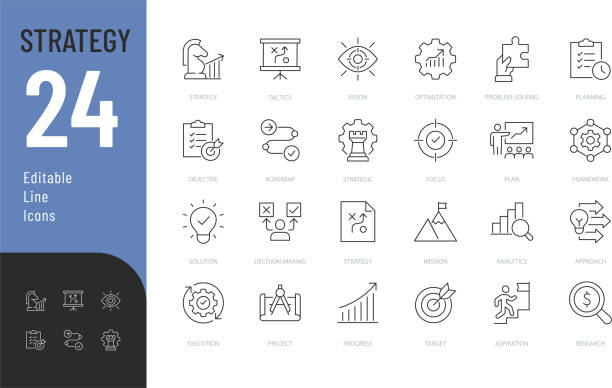
Vector illustration in modern thin line style of business related icons: tactics, vision, target, and more. Pictograms and infographics.

Performance Editable Stroke - Pixel Perfect - Line Icons


A focused mentor is explaining project to mentees at the boardroom at enterprise.


Close up of three people looking at financial data with graphs and charts. All their hands can be seen and one person is pointing with a pen. There is paperwork on the desk showing more finance information

Vector illustration in modern thin line style of analytics related icons: balance, charts, report, and other. Pictograms and infographics for mobile apps.

Three professionals are engaged in a business meeting with one man presenting a digital tablet showcasing work-related content

3D render of perspective view of KEY PERFORMANCE INDICATORS business concept banner on dark blue background



Abstract Finance Technology Concept - 3d rendered image. Fintech background. Analyzing Digital Data, Statistics, Financial Chart, Economy, Stock market idea. Financial technology graph with trends lines.

Group of middle aged multiethnic business professionals collaborating around table, reviewing documents and using laptop, top view showing teamwork and corporate meeting environment


Close-up of business analyst reviewing financial data on tablet in office, demonstrating the use of technology in modern business environments.




Diverse group of business people collaborating in an office setting. They engage in teamwork and discussion, working together on laptops.



A team of multiethnic developers is meeting to review the data analysis of marketing from social media platforms.

Flat design modern vector illustration concept of website analytics search information.

Containing goal, tactics, vision, plan, objective, roadmap, problem-solving, mission, solution and execution. Solid vector icons collection.


Vector illustration in flat style of a close-up group of people analyzing tabs with graphs and statistics. Isolated on background

Dynamic abstract image of financial data and stock market analysis, featuring colorful candlestick charts and digital data graphs in a futuristic blue-toned background. Represents investment trends, trading strategies, and financial technology concepts.


Successful business, growth strategy and achieving goals with the rising arrow. Business strategy development and growing growth plan


Paperwork and group of peoples hands on a board room table at a business presentation or seminar. The documents have financial or marketing figures, graphs and charts on them. People are pointing at the data. There is a T.V. with financial data in the background

Analyst working with Business Analytics and Data Management System on computer to make report with KPI and metrics connected to database. Corporate strategy for finance, operations, sales, marketing

Close up of businessman using a laptop with graphs and charts on a laptop computer. The mans hands can seen typing on a keyboard.

A diverse group of professional individuals engaged in a business meeting within a bright beige office, illustrating teamwork, collaboration, and leadership.

Business intelligence. Diagram, Graph, Stock Trading, Investment dashboard. Arrows up.
of100Next