00:21
Browse 294,100+ chart stock videos and clips available to use in your projects, or search for graph or infographic to find more stock footage and b-roll video clips.

3d rendered financial graphs, symbolizing success and positive market conditions. Seamlessly Loopable. Perfectly usable for topics like stock exchange, financial technology or business and economy in general.

African American woman analyzing financial data on laptop screen in hybrid office setting for digital entrepreneurship KPI dashboard.

Variety of graphs and charts with different numbers and percentages - Motion infographics

Charts, Graphs, Diagrams Growing on Digital Blue Screen Close-up Beautiful 3d Animation. Abstract Stock Market Business Information and Financial Data Illustration. Modern Technology Concept 4k.

Close up of businessman using a laptop with graphs and charts on a laptop computer. The mans hands can seen typing on a keyboard.

Stock market chart moving up, graph illuminated in green. Business, risk, stock exchange, moving up, investment, growth, trading. 3D animation

Stats analysis reports and financial data 3D. Ideal for financial, banking, scientific and mathematical medical topics. Perfect for background or high quality and professional opening and closing. Abstract animation in motion graphics 4K ProRes 4444 loopable.

Blue-colored moving stock market infographics in animation.

Stock chart going down. Share price animation. Investment concept.

Falling stock market chart, reflection and defocus. Recession, crisis, bear market, crash, depression era, negative, weak business.

Futuristic digital growth concept with glowing arrows and financial graph, symbolizing innovation, technology, and business success.

Financial market data and statistics report - 3D

A young woman close to a screen with a graph and also reflecting in her spectacles.

Animated statistical graphs. Data organization plots animation library. Bar charts, pie diagrams. Colorful illustrations on white background. HD video with alpha channel. Motion graphic

Screen Stock exchange market chart, Candle stick graph chart of stock market trading,
Close-up asia business people meeting plan analysis statistics brainstorm and header of team hold tablet pointing graph chart and employee take note. Finance strategy statistics success concept.

urban skyline timelapse with Business data Analytics dashboard Technology Overlay, Futuristic Design for Financial and business concepts
Chart with Arrow Flat Icon. Pixel Perfect. For Mobile and Web.

Animated graph in a digitally generated cityscape, perfectly usable for all kinds of topics related to finance, business and stock exchange.

Data Transfer Analysis Artificial Intelligen -Loopable

Animated business statistics infographic with blue data, graphs and diagrams on white background.

Trading on Stock Exchange. Charts on digital screen close-up. 4k UHD live trading charts and stats

Currency chart showing rates going down and up

Stock market chart moving up, rising share prices, profit. Data, success, positive, growth, trading, risk, volatility, investment. 3D animation

Animation of a business infographics with rising arrow and bar stats appearing.

Stock Market Chart, Beautiful 3d Animation of Japanese Candlestick Graph in TimeLapse. Seamless Looping Ultra HD 4K 3840x2160

3d rendered video, seamlessly loopable. Perfectly usable for all kinds of topics related to data and digital analytics.

Man Using a Laptop with Business data Analytics dashboard animated overlays

stock market and exchange news isolated motion design element

Closeup - Female eyes in eyeglasses late at night scrolling in front of laptop. Coder, she checking Bitcoin price chart on digital exchange on smartphone, cryptocurrency future price action prediction

Technology Blockchain Connection Dot to Dot Has Yellow dot flicker while connected Macro Focus Bokeh, Plexus Polygon Histogram Trading Charts Concept 3d render
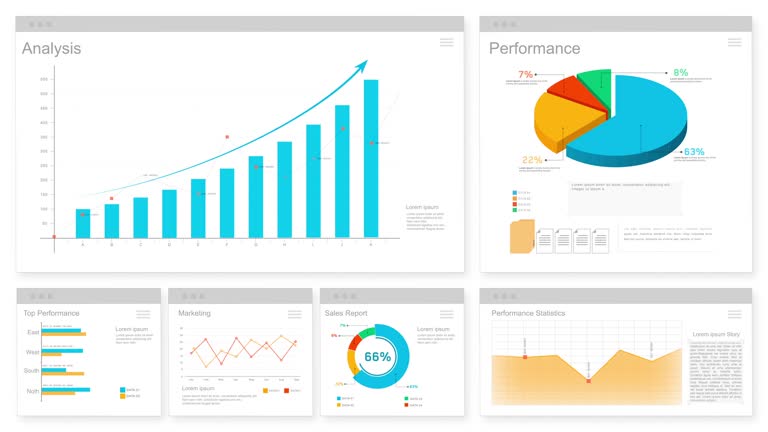
Financial business diagram charts colorful business screen digital display hologram white window background, Digital technology, Interface, Financial budget, Business planner diagram graphs financial analytics

Computer Graphic, Digital Tablet, 4K Resolution, Analyzing

Doctor, Writing - Activity, Handwriting, Doctor's Office, Hospital
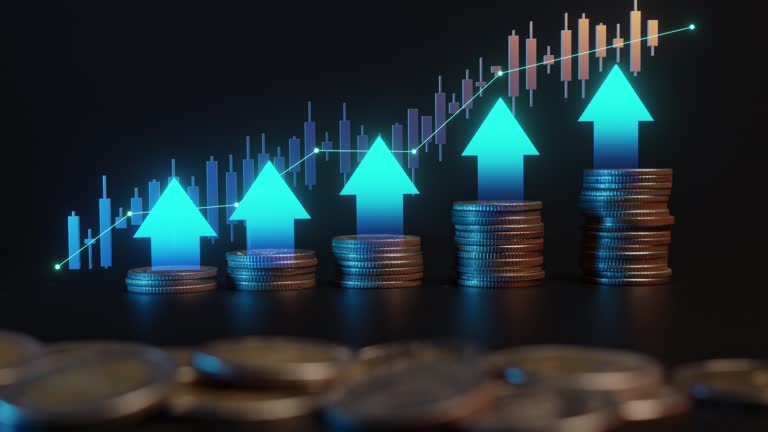
A hand stacks coins as a digital graph and arrows indicate financial growth and positive investment trends.

4k video footage of two businesswomen using an interactive whiteboard to analyse data in an office

Hands, medical folder and doctor with results, person in hospital with signature, surgeon and healthcare document. Reading health report, sign off with paperwork and medicine, check info and chart

4k loopable financial chart and stock market bar chart for use as financial report and stock market presentation

HD1080p: Long Dolly shot of a group of executives participating to the presentation of the financial report in a modern glass conference room.

Close up of a young woman computer data graph reflecting in her spectacles.

A conceptual animation of a big change in the stock market. Animated stock market data on a dark background.

Business data with chart, lines, numbers. Trading, progress, success, growth, financial figures and rising revenues or earnings. 3D animation
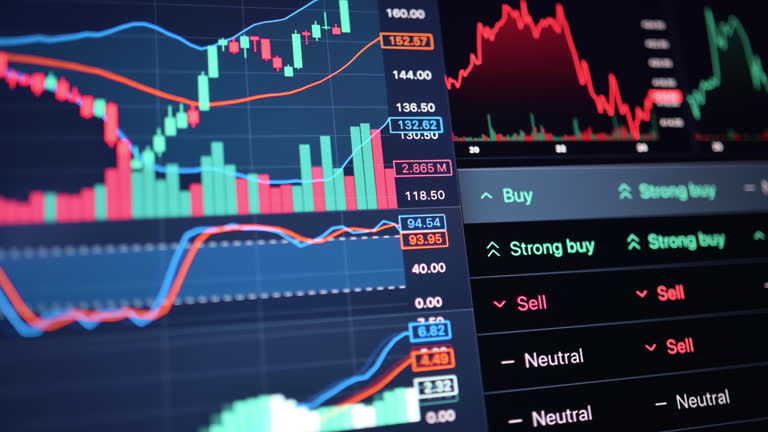
market volatility, cinematic shot, bokeh effect, glowing lines, abstract finance, trend reversal, data dynamics, digital trading, risk management, financial fluctuation, stock exchange, technology

Business women talking, planning and looking at stats, data and a graph on a desktop computer screen while working late at night in an office. Female colleagues analysing a chart and working overtime

Dynamic infographic charts on a blue background. The charts show the constant growth of sales and profit increase every month of the year. Despite price increases, profit margins are showing growth.

Man, nurse and hands writing with document for medical prescription, patient records or inusrance at hospital. Japanese, closeup or doctor with notes or filling health form, survey or application

Medium handheld shot of a Caucasian woman discussing a graph shown on the screen in the meeting room with her African-American male colleague. Shot in Slovenia.

KPI Dashboard Data Analytics On Business Laptop

Animated flight through financial graphs and figures, seamlessly loopable and highly detailed. Perfectly usable for all kind of topics related to business, finance and stock exchange.

2025 Businessman analyzing company financial balance sheet working with digital virtual graphics Businessman calculating financial data for long term investment growth goals

Futuristic Interface, Hud, Fui, Digital Screen Glass Panel, Control Dashboard

Document management concept, check electronic documents on digital documents on virtual screen Document Management System and process automation to efficiently document paperless operate