00:10
3d rendered video, seamlessly loopable. Perfectly usable for all kinds of topics related to data and digital analytics.
The iStock video library has more than 1.2 million infographic stock videos. Browse the easy-to-search collection to find stock videos of infographic templates videos of people looking at infographics at work and close-up videos of graphs and charts printed out on paper. You can also find videos of maps and diagrams.
3d rendered video, seamlessly loopable. Perfectly usable for all kinds of topics related to data and digital analytics.

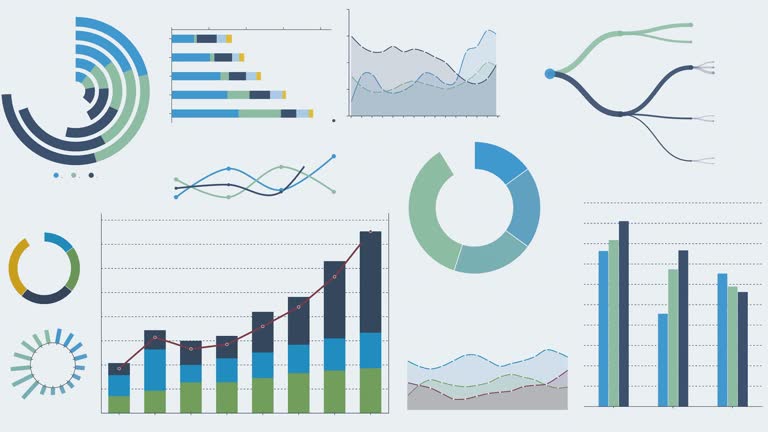
Variety of graphs and charts with different numbers and percentages - Motion infographics

Charts, Graphs, Diagrams Growing on Digital Blue Screen Close-up Beautiful 3d Animation. Abstract Stock Market Business Information and Financial Data Illustration. Modern Technology Concept 4k.

3D animation of a sphere dynamically forming, illustrating intricate data flow within an artificial intelligence network.The sphere is composed of cube nodes interconnected by lines, representing complex data processes. Ideal for presentations on AI, machine learning, data analytics, and visualizing intricate digital networks.

Financial market data and statistics report - 3D

Man Using a Laptop with Business data Analytics dashboard animated overlays

A clean and modern red and white circle shape animation, perfect for abstract reveals and overlay design elements. This smooth and minimalistic motion graphic is ideal for transitions, video editing, presentations, and creative projects requiring geometric aesthetics.

Data Transfer Analysis Artificial Intelligen -Loopable

2 videos in 1 file. Financial data and charts showing increasing profits. Dolly in. Loop able.

Animated startup launch infographic. Minimum viable product. Looped HD text chart template video on white with alpha channel transparency. Interactive animation with copy space and 4 step sequence

Abstract AI neural network concept. Blue glowing lines, interconnected data, digital particles on dark background. Represents technology, big data, machine learning, global communication, future.

Digitally generated animation with copy space, seamlessly loopable. Perfectly usable for all kinds of topics related to financial technology, business and economy, user statistics or data science.

4k resolution Technology Abstract background, Digital binary data wave loop background,Technology wire frame Futuristic,

Technology digital wave background concept.Beautiful motion waving dots texture with glowing defocused particles. Cyber or technology background.

Programming code abstract technology background footage,concept of software developer and Computer script.4k seamless loop

3d rendered video, seamlessly loopable. Perfectly usable for all kinds of topics related to data and digital analytics.

Animated Infographics set. Dashboard With Charts And Data About Sales, Expenses And Profit On White Background For Business Development And Strategy. Profits are shown in charts and stock numbers on an infographic business map and graph.

urban skyline timelapse with Business data Analytics dashboard Technology Overlay, Futuristic Design for Financial and business concepts

Seamless loop futuristic particle beam stream, digital data flow. Dynamic pattern with power rays and light.

Animated development infographic. Business solution. HD infochart template video on white with alpha channel transparency. Flowchart mockup with blank space for content and 4 step sequence

Abstract Data Chart - 3d rendered video. Machine learning concept. Analyzing Digital Data idea. Big data graph representation with flowing data blocks.

Graphic showing the growth of dynamic groups in motion. It expands and divided into groups in the form of flow chart animation.

3d generated world map with glowing data lines. Perfectly usable for all kinds of topics related to international business and finance, global data or technological innovation.Created from textures by NASA:https://visibleearth.nasa.gov/images/55167/earths-city-lights,https://visibleearth.nasa.gov/images/73934/topography

Analysis data charts and graphs visualizations - Motion infographics

Motion infographic HUD for screen replacement or presentations. Colorful infographics interface with alpha channel included for Luma mate

A set of animated infographic objects. Motion design with alpha channel.

Futuristic Digital line Technology Concept Data Flow Coding, Connection presentation, social media Machine learning binary matrix deep space cyber space. Hyperspace network growth deep learning

Futuristic Interface, Hud, Fui, Digital Screen Glass Panel, Control Dashboard

Start social media advertising infographic circles animation. Strategic planning, audience targeting. Flowchart dynamic presentation with 5 steps process. HD video, motion graphics

Financial business diagram charts business and finance, Data analysis corporate

Animation of a business infographics with rising arrow and bar stats appearing.

A high-impact conceptual visual featuring a business professional utilizing a mobile device to interact with a futuristic, holographic dashboard. The interface displays real-time business intelligence (BI) through various charts, graphs, and performance metrics, set against the backdrop of a dense, modern city skyline. This image perfectly illustrates the power of AI-driven data analytics and Big Data processing being applied directly in the urban environment, enabling instantaneous, informed decision-making and showcasing the future of mobile commerce and professional technology.

Abstract infographics animation of financial stock data. Perfect for your business video or presentations. You can use this stock motion graphics video as a background to your graphic or titles.

Chart colorful business screen digital display hologram white background, Map Location WIFI 5G, Digital technology, Interface, Financial budget, Business planner diagram graphs financial analytics

A young woman close to a screen with a graph and also reflecting in her spectacles.

Business stock market, trading, info graphic with animated graphs, charts and data numbers insight analysis to be shown on monitor display screen for business meeting mock up theme

Connection cyberspace technology by particle lines stream data. Neon strips rising upwards abstract background 3D 4K UHD video seamless loop

Abstract technology big data background concept. Motion of digital data flow. Transferring of big data. Transfer and storage of data sets, blockchain, server, hi-speed internet.

Lifecycle circulation icon with 5 arrows. Circle animation with five parts. Thick flat renew and recycle circle. Green color on white background.

Animated flowchart icon. Work process line animation. Step by step organization. Project management tool. Black illustration on white background. HD video with alpha channel. Motion graphic
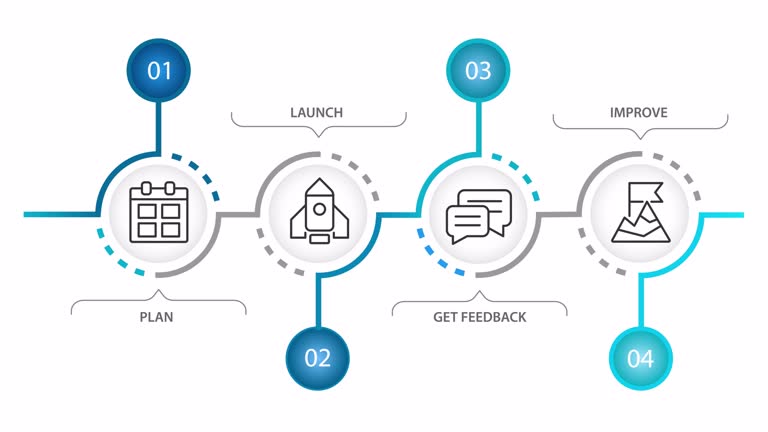
Animated MVP launch infographic. Product development. Lean startup. Looped HD info chart template video on white with alpha channel transparency. Interactive flowchart animation with 4 step sequence

Big data abstract technology Matrix background, light data waving animation. digital landscape particle. Crypto currency, data flow. Transferring Artificial Intelligence Quantum Computer, block chain

Timelapse of Hong Kong city skyline double exposure with Business data Analytics dashboard Technology, Futuristic Design for financial technology and business concepts

Technology digital big data connection on blue background

Digitally generated emerging city, perfectly usable for all kinds of topics related to the construction industry, as well as city life and infrastructure in general.

digital generated animation about the need of social distancing during COVID-19 pandemic

Timeline Animation is an infographic element on an alpha channel in monochrome color. It is easy to use and can be quickly added in to your presentations, slideshows and promo videos.

3d rendered animation, seamlessly loopable. Perfectly usable for all kinds of topics related to data and digital analytics.

Dynamic infographic charts on a blue background. The charts show the constant growth of sales and profit increase every month of the year. Despite price increases, profit margins are showing growth.

Employment management infographic infographic circles animation. Workflow organization. Employee advocacy, engagement. Flowchart dynamic presentation with 5 steps process. HD video, motion graphics

4K Financial Business Charts, Graphs And Diagrams. 3D Stock Market Infographics