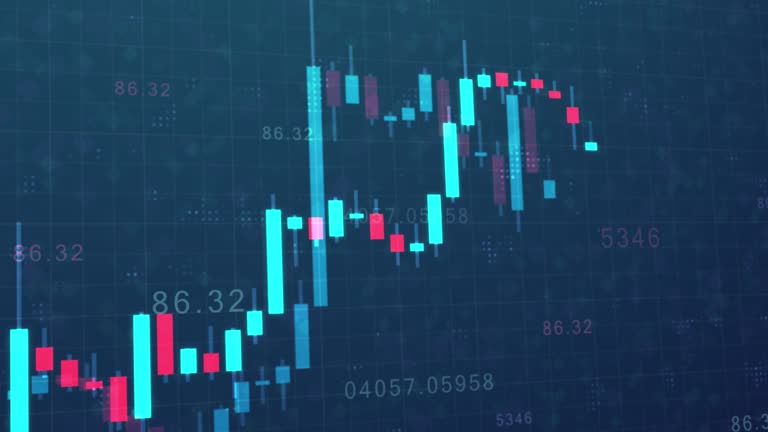
00:28
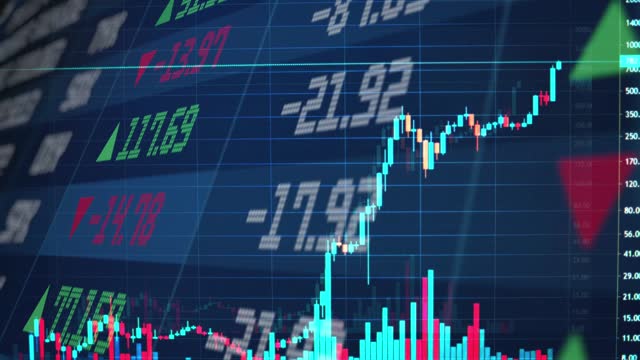
Stock market chart moving up, graph illuminated in green. Business, risk, stock exchange, moving up, investment, growth, trading. 3D animation
Browse 90,200+ stock market data stock videos and clips available to use in your projects, or search for stock market or stock market data screen to find more stock footage and b-roll video clips.
Stock market chart moving up, graph illuminated in green. Business, risk, stock exchange, moving up, investment, growth, trading. 3D animation

Falling stock market chart, reflection and defocus. Recession, crisis, bear market, crash, depression era, negative, weak business.
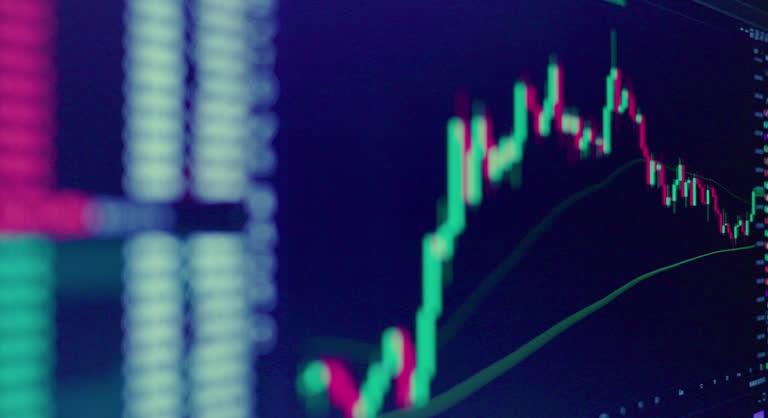
Screen Stock exchange market chart, Candle stick graph chart of stock market trading,

A view of a down stock market ticker. Numbers are fictional and do not represent any particular stock.

Stock chart going down. Share price animation. Investment concept.
Currency chart showing rates going down and up

Close up line chart and moving average, portfolio information moving along the graphs. Wealth management, stock portfolio, percentage changes. Investment, equity, business.
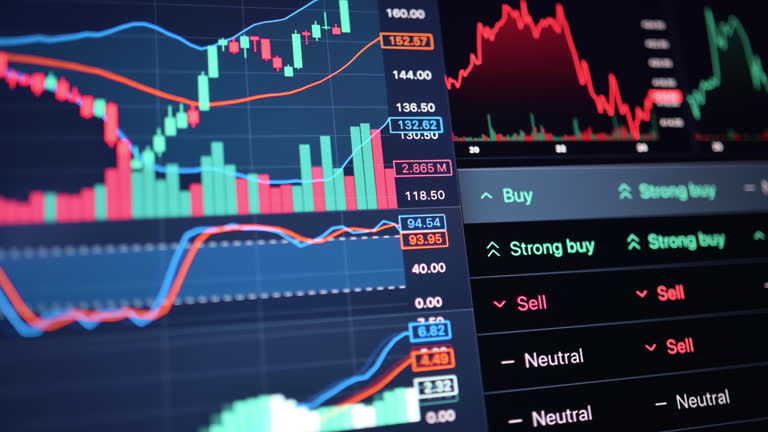
market volatility, cinematic shot, bokeh effect, glowing lines, abstract finance, trend reversal, data dynamics, digital trading, risk management, financial fluctuation, stock exchange, technology

3d rendered financial graphs, symbolizing success and positive market conditions. Seamlessly Loopable. Perfectly usable for topics like stock exchange, financial technology or business and economy in general.

Stock market chart moving up, rising share prices, profit. Data, success, positive, growth, trading, risk, volatility, investment. 3D animation

Close up of businessman analyzing trading data late at night, staring at a monitor with stock indexes and economic charts reflecting in his glasses, evaluating investment strategies on crypto market.

Trader Investors check financial news and stock market index updates on their tablets.

4K Time lapse of Stock Market Data over the led monitor around Mong Kok, Hong Kong
Stock Market and Exchange, Exchange Rate, Exchanging, Graph, Data

Closeup - Female eyes in eyeglasses late at night scrolling in front of laptop. Coder, she checking Bitcoin price chart on digital exchange on smartphone, cryptocurrency future price action prediction

Animated graph in a digitally generated cityscape, perfectly usable for all kinds of topics related to finance, business and stock exchange.

Trading on Stock Exchange. Charts on digital screen close-up. 4k UHD live trading charts and stats

Wall Street - Lower Manhattan, Stock Market and Exchange, Stock Market Data, Trading Board, New York Stock Exchange
Futuristic digital growth concept with glowing arrows and financial graph, symbolizing innovation, technology, and business success.

Stock chart going down. Share price animation. Investment concept.

close up of professional trader closely monitors financial analytics, with forex and stock market charts reflected in his eyeglasses, assessing crypto market movements.

A view of a down stock market ticker as a result of American tariffs. Numbers are fictional and do not represent any particular stock.

A conceptual animation of a big change in the stock market. Animated stock market data on a dark background.

Computer Graphic, Digital Tablet, 4K Resolution, Analyzing

Glowing bar graph with upward arrow over coins, representing financial growth, investment success, and positive market trends.

Screen with different commodities, metals, copper, zinc, gold,silver or crude oil, natural gas, prices and percentage changes. Business, commodity trading, investment, supply and demand.

Business women talking, planning and looking at stats, data and a graph on a desktop computer screen while working late at night in an office. Female colleagues analysing a chart and working overtime

A view of a changing stock market ticker. Numbers are fictional and do not represent any particular stock. Bull and bear market concept.

Animated flight through financial graphs and figures, seamlessly loopable and highly detailed. Perfectly usable for all kind of topics related to business, finance and stock exchange.
Screens filled with sharp red trend lines depict intense market decline, economic disruption, and investment downturn. recession fears, portfolio losses, trading risk, market analysis under pressure, and financial instability in global economies.

A young woman close to a screen with a graph and also reflecting in her spectacles.

Animated flight through financial graphs and figures, seamlessly loopable and highly detailed. Perfectly usable for all kind of topics related to business, finance and stock exchange.
Online gold and silver trading on digital screen corporating with AI financial business data on commodity investment for choosing timing investment strategy financial data and charts business background
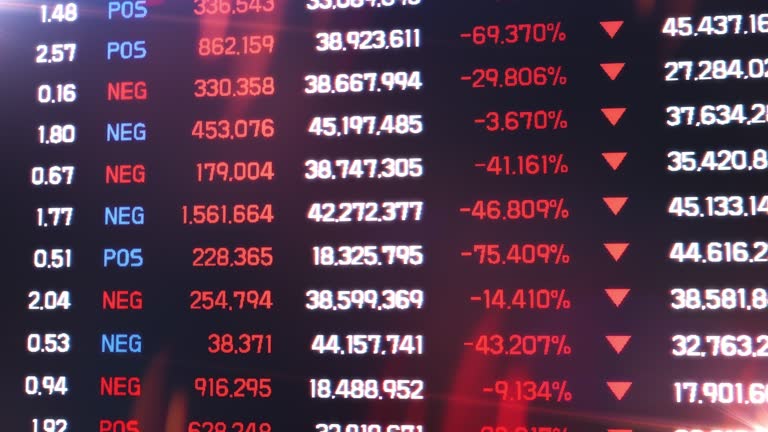
Abstract financial background, economic report, forecast

urban skyline timelapse with Business data Analytics dashboard Technology Overlay, Futuristic Design for Financial and business concepts
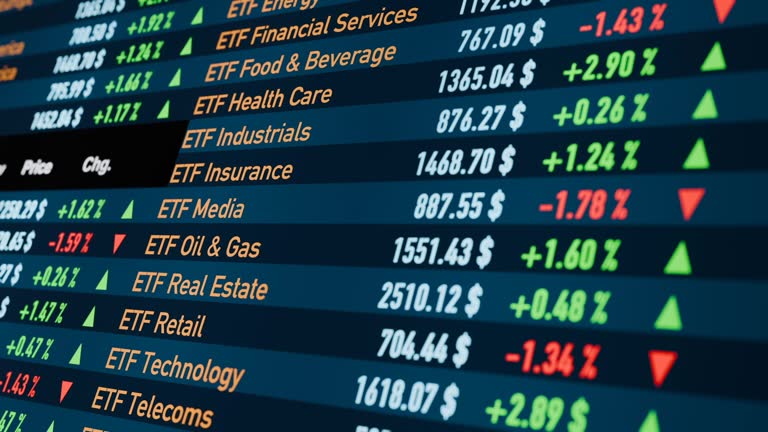
ETF (Exchange Trade Funds) trading sheet, investment opportunities. Country, commodity, bond and industry sector ETF. Banking, savings, stock market and exchange, growth, strategy. 3D animation

A view of an up stock market ticker. Numbers are fictional and do not represent any particular stock. Bull market concept.

Stock Market and Exchange, Finance, Stock Market Data, Economy
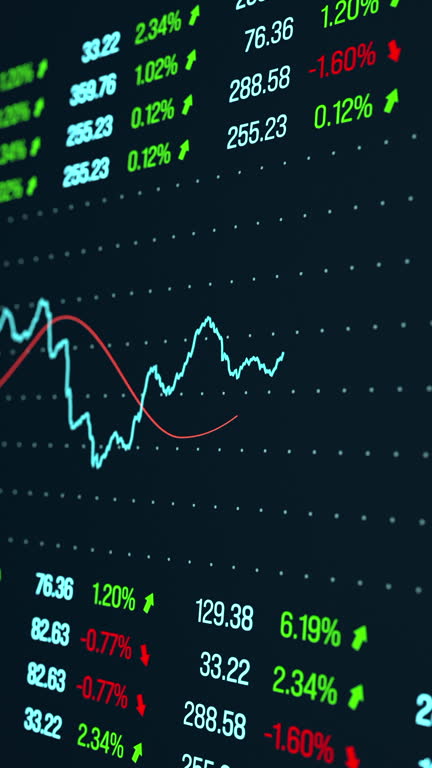
Stock index chart moves up and down, market data, trading, financial figures. Business, investment, risk, chance, graph, making money.
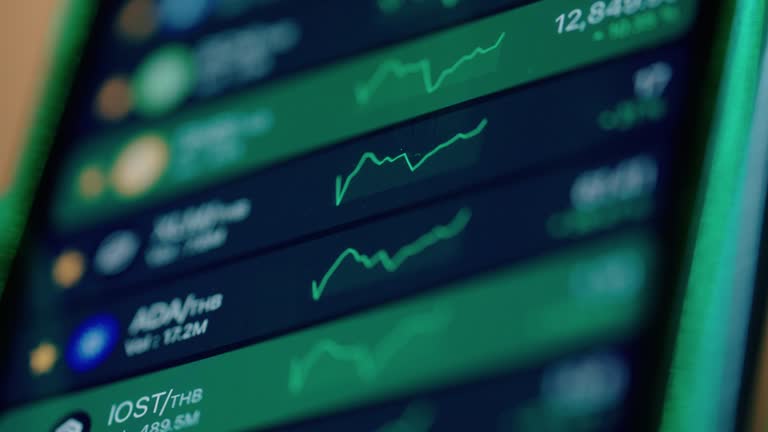
Stocks trading chart suitable for financial investment.

Timelapse of Hong Kong city skyline double exposure with Business data Analytics dashboard Technology, Futuristic Design for financial technology and business concepts

Stock market and exchange, ticker with index changes. Financial markets, cities and percentage index changes, trading, investment. London, Paris, New York, Sydney, Tokyo, Prag, Frankfurt and more.
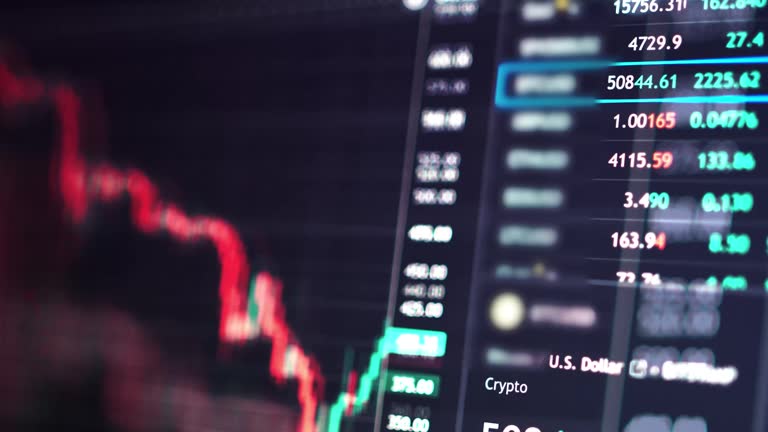
Generic and representative stock market and exchange screens with speed animation and duplicate effect
Abstract Data Chart - 3d rendered video. Machine learning concept. Analyzing Digital Data idea. Big data graph representation with flowing data blocks.