Medical Charts And Graphs stock illustrations
Browse 2,600+ medical charts and graphs stock illustrations and vector graphics available royalty-free, or start a new search to explore more great stock images and vector art.
Most popular
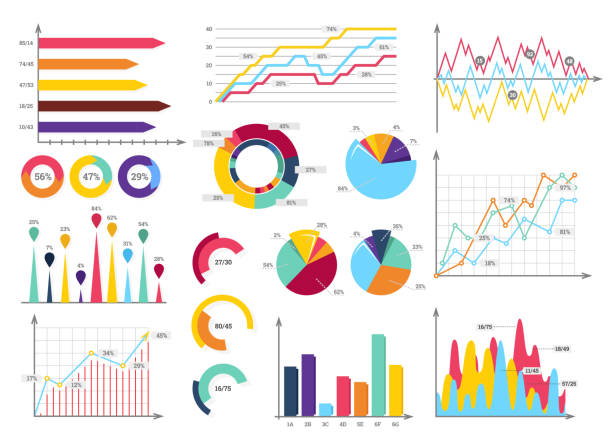
Set elements of infographics. Info bars, graphycs
Neumorphism modern bar chart statistics gauges moving up design.
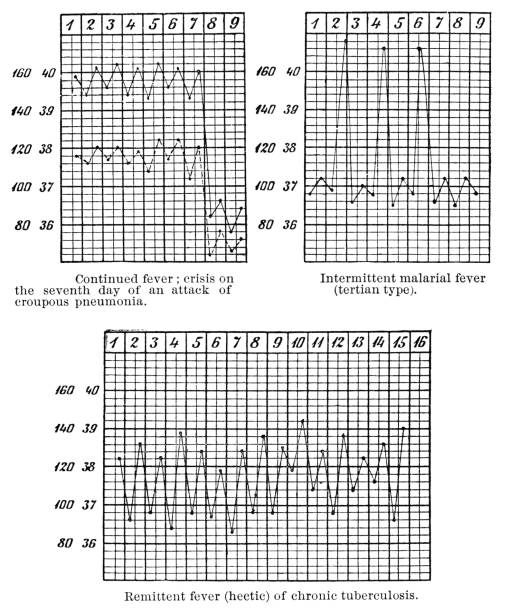
Charts showing the temperature patterns of different types of fever. Vintage etching circa mid 19th century.
Project task management and effective time planning tools. Project development icon. 3d vector illustration. Work organizer, daily plan. Project manager tool, business, productivity online platform

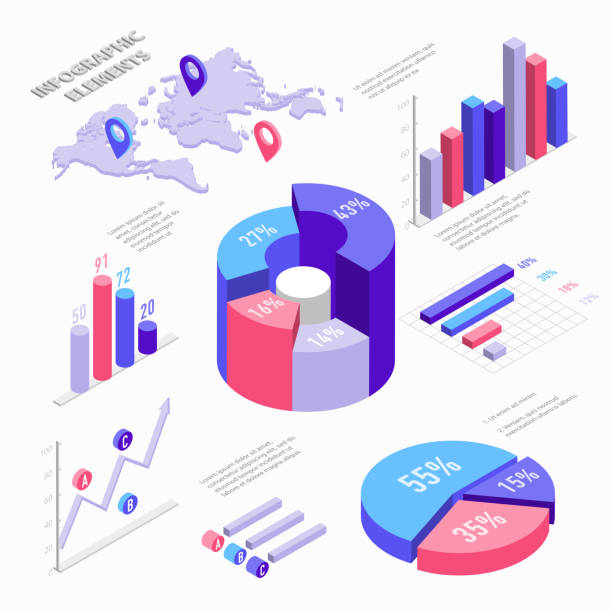
Isometric infographic elements with charts, diagram, pie chart, world map with pins and graphs with percent. Set of Isometric bar charts vector flat illustration isolated on white background


Mobile telephone mobile device cell phone showing data and statistics dashboard held by a person in their hand.
Red arrow. 3d UP financial graph isolated on white background. Vector illustration. Eps 10.
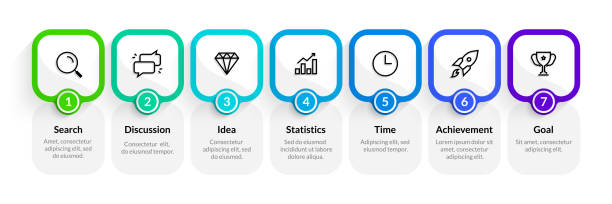
Process diagram. Flowchart graphic template, evolution sequence infographic, simple option process chart. Vector illustration step timeline diagram presentation elements flowchart


10 Bars Infographics for Business and Other Data Entry and 10 Columns Infographic for Graph, Chart Preparation

Human brain futuristic medical hologram vector illustration. Brain model screening virtial reality interface. Diagrams, pie chart infographics. vr and ar medicine and healthcare icons


Smiling businessman consider graph and chart, make financial market analysis. Happy male employee or worker analyze finances statistics and research. Business plan concept. Vector illustration.

Human heart futuristic medical hologram vector illustration. Heart model screening virtial reality interface. Diagrams, pie chart infographics. vr and ar medicine and healthcare icons
Vector medical, coronavirus, virus infographics set. CoV icons, elements charts banners

Set of Gaussian or normal distribution histograms. Bell curve templates with columns. Probability theory concept. Layouts for financial, statistics or logistic data. Vector illustration

Human liver futuristic medical hologram vector illustration. Liver 3d model screening virtial reality interface. Diagrams, pie chart infographics. vr and ar medicine and healthcare icons.

Concept Of Business And Financial Analysis, Trends Forecast And Teamwork. Black Silhouettes Of Business Characters Making Pie Chart, Holding Pieces In Hands. Cartoon Flat Style. Vector Illustration.

NPS - Net promoter score sign, label. Vector stock illustration

Four pieces puzzle squares diagram. Squares business presentation infographic. 4 steps, parts, pieces of process diagram. Section compare banner. Jigsaw puzzle info graphic. Marketing strategy.

One continuous line drawing of graph icon isolated on white background. EPS10 vector illustration for banner, web, design element, template, postcard. Growing graph, chart image.

Embryo development month and trimester stages vector illustration isolated on white background. Process of human fetal growth in flat cartoon style for pregnancy infographic.
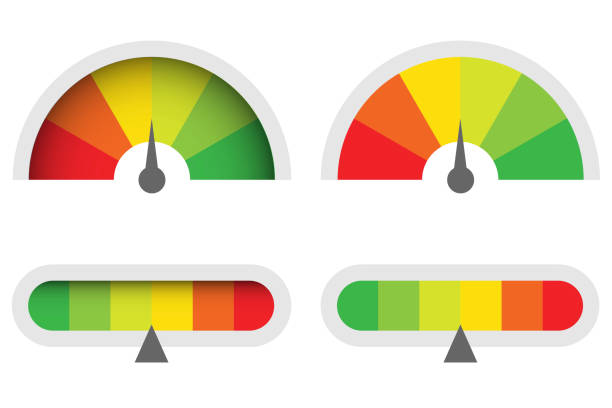
Infographic illustration for web design. Gauge vector icon.


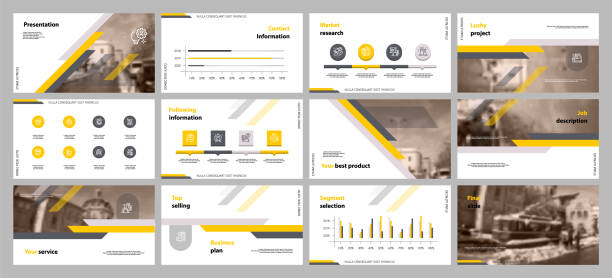
Infographic dashboard template with flat design graphs and charts

Chart showing the mortality rates of different infections in a year by month. Vintage etching circa mid 19th century.
Set of growing graph icons. Profit growing vector, chart increase profit. Graph with arrow. Vector illustration. Eps 10.


Chart showing the temperature pattern of a patient with typhus fever. Vintage etching circa mid 19th century.

Seven pieces puzzle squares diagram. Squares business presentation infographic. 7 steps, parts, pieces of process diagram. Section compare banner. Jigsaw puzzle info graphic. Marketing strategy.
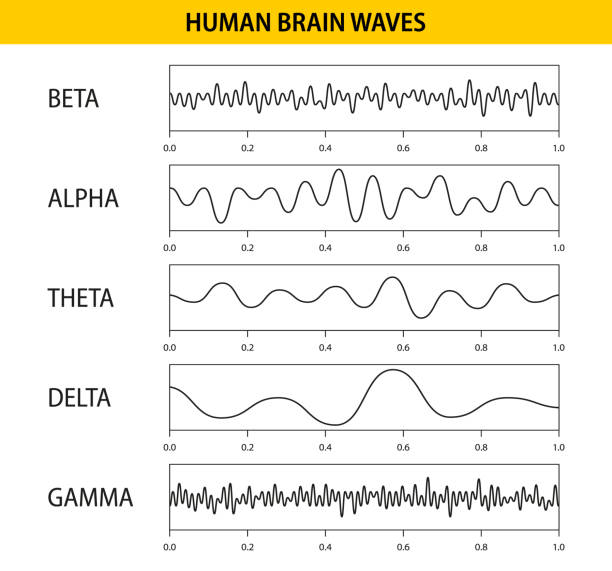
Beta, alpha, theta, delta, gamma brain waves. Set of brain waves oscillation. Human rhythm, types, amplitude of mind waves. Vector illustration.
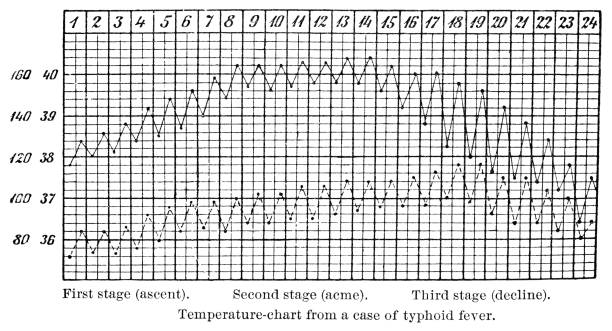
Chart showing the temperature pattern of a patient with typhoid fever. Vintage etching circa mid 19th century.


Infographic illustration for web design. Gauge vector icon.


Infographic chart. Timeline graph elements with flow diagrams and percent line bars, business process graph. Vector presentation flowchart set

Spreadsheet line icons, signs, vector set, outline concept linear illustration

Technology graphics and diagram with options and workflow charts. Vector presentation infographic elements. Digital screen graphic and virtual interface diagram illustration.
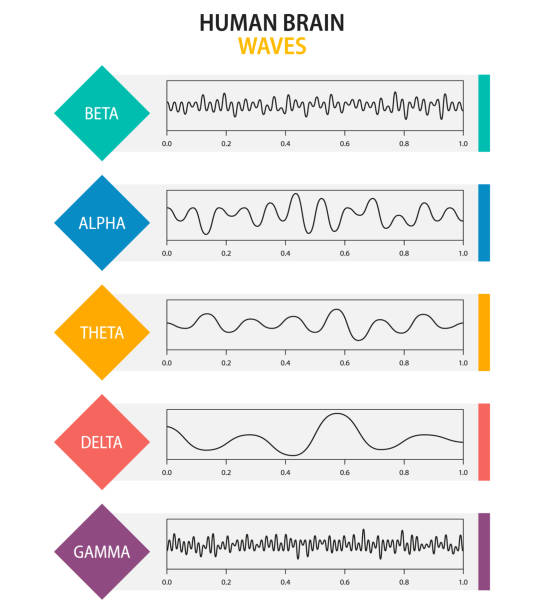
Set of brain waves oscillation. Beta, alpha, theta, delta, gamma brain waves. Human rhythm, types, amplitude of mind waves. Vector illustration.
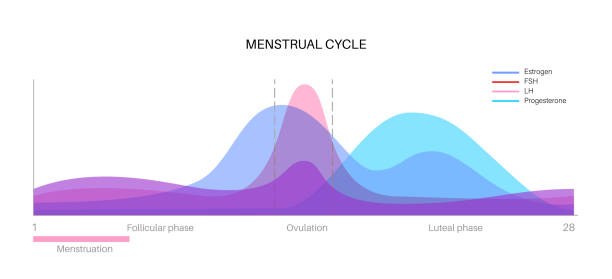
Menstrual cycle graphic. Hormones in the female body. Estradiol, progesterone, FSH, and LH value in the woman body in follicular phase, ovulation and luteal phase maximum and minimum level flat vector

Flat linear graph chart. Infographic dashboard template with flat design graph

Data statistics and analysis charts and graphs blue software computer windows interface GUI.
Set of red arrow. 3d UP financial graph isolated on white background. Vector illustration. Eps 10.

Mobile application interface design. Statistics dashboard piechart information screen. Infographic dashboard template with flat design graphs and charts
Heartbeat Flat Icon.

Data chart graph financial analysis and statistics abstract modern background.
Next