Illustrations
Browse 58,100+ bar graph icon stock illustrations and vector graphics available royalty-free, or search for bar graph icon vector or bar graph icon in circle to find more great stock images and vector art.
Infographic Elements Line Icons. Pixel perfect. Editable stroke. Vector illustration.
Vector line icon set appropriate for web and print applications. Designed in 48 x 48 pixel square with 2px editable stroke. Pixel perfect.
Simple vector line Icons. Editable stroke. Pixel perfect.
Icon of "Growing graph" for your own design. Three icons with editable stroke included in the bundle: - One black icon on a white background. - One line icon with only a thin black outline in a line art style (you can adjust the stroke weight as you want). - One icon on a blank transparent background (for change background or texture). The layers are named to facilitate your customization. Vector Illustration (EPS file, well layered and grouped). Easy to edit, manipulate, resize or colorize. Vector and Jpeg file of different sizes.
Containing data, increase, growth, pie chart, data analytics, business, report and more. Solid vector icons collection.
A set of black and white chart and graph icons.
Vector Icons - Adjust stroke weight - Expand to any size - Change to any colour
Internet Marketing, the media, big data, computer network, solution, communication
Growing bar graph icon vector in flat style. Rising arrow symbol illustration

Combined Bar and Line Graph: Visual Data Representation for AnalysisThis image features a combined representation of a bar graph and a line graph, ideal for visualizing data effectively. It includes five vertical bars of varying heights, arranged in ascending order from left to right. Overlaying the bars is a line graph with three connected points, corresponding to the tops of the first, third, and fifth bars. This combination allows for easy comparison of different quantities while highlighting trends over time or across categories. Perfect for statistical analysis and business reporting, this visual format provides two perspectives on the same data set, enhancing understanding and insight.
Containing data, web statistics, survey, prediction, presentation, cloud analysis and pie chart icons.
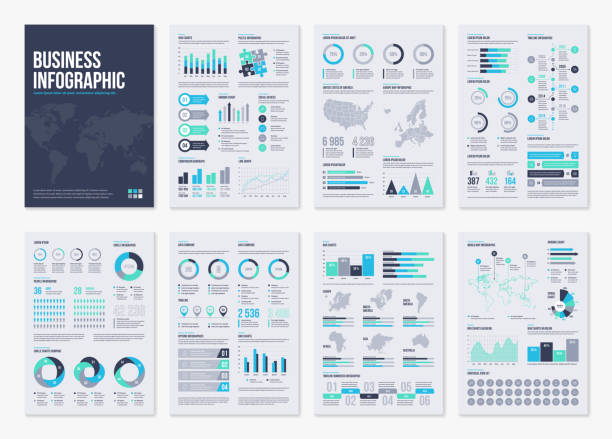
Infographic brochure elements for business data visualization. Vector illustration in modern flat info graphic style.
Well organized and fully editable Vector icon for vector stock and many other purposes.
Efficiency - thin line vector icon set. 20 linear icon. Pixel perfect. Editable outline stroke. The set contains icons: Efficiency, Growth, Target, Test Results, Urgency, Stopwatch, Speedometer, Runner, Rocketship, Medal, Brainstorming.
Vector illustration in modern thin line style of business infographic related icons: donut chart, diagram, arrows, and more. Pictograms and infographics for mobile apps
Graphic icon set. Bussines infographic illustration symbol. Sign chart up vector flat.

Circle progress bar set with percentage text from 0 to 100 percent. Turquoise blue, light grey. Infographic, web design, user interface. Flat design. Vector illustration, no transparency, no gradients
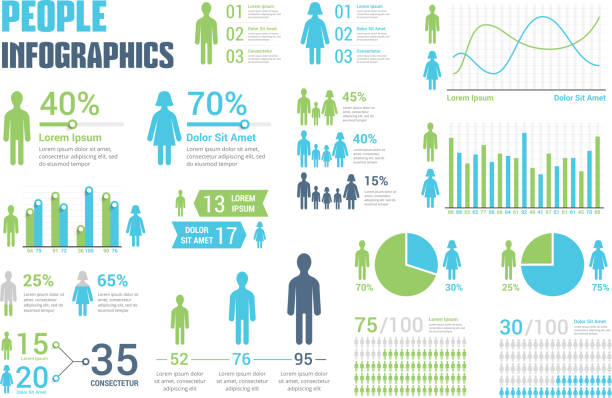
People infographics for reports and presentations - percents, bar and line graphs, pie charts, vector eps10 illustration
Line chart and Diagram duotone icons on white background. Vector illustration.
charts diagrams and graphs flat icons vector
Increase Dollar Currency Chart Icon in Blue Gray Color
20 Outline Style - Black line - Pixel Perfect icons / Set #46 Icons are designed in 48x48pх square, outline stroke 2px. First row of outline icons contains: Organization Chart, Financial Report, Cloud Computing, Bar Graph, Brainstorming; Second row contains: Moving Down Chart, Bar Graph Chart, Dashboard Chart, Analyzing Chart, Moving Up Chart; Third row contains: Mobile Phone and Graph, Laptop Chart, Separating Funnel, Clipboard and Pie Chart, Network Server; Fourth row contains: Calculator, Gears icon, Magnifying glass and Chart, Flask and Check mark, Conference. Complete Primico collection - https://www.istockphoto.com/collaboration/boards/NQPVdXl6m0W6Zy5mWYkSyw
20 Outline Style - Black line - Pixel Perfect icons / Set #39 / Infographics / Icons are designed in 48x48pх square, outline stroke 2px. First row of outline icons contains: Projection Screen with growing arrow, Flow Chart, Planning Chart, Organization Chart, 3D Pie Chart; Second row contains: Moving Down Chart, Diagram, Pyramid Chart, Alphabetical Order, Moving Up Chart; Third row contains: Triangle Report Chart, Data line Chart, Circle Report Chart, Line Graph Chart, Financial Report Chart; Fourth row contains: Bar Graph Chart, Multi - Layered Effect, Spreadsheet, Pie Chart, Dashboard Chart. Complete Primico collection - https://www.istockphoto.com/collaboration/boards/NQPVdXl6m0W6Zy5mWYkSyw
Finance, investment, bank,
Info Graphic, chart, finance, technology, design element, progress report, analyzing,
Charts Icons - Vector Line Icons. Editable Stroke. Vector Graphic
A set of rounded corner App-style icons. File is built in the CMYK color space for optimal printing. Color swatches are global so it’s easy to edit and change the colors.
A set of twenty-five square flat design icons with long side shadows. File is built in the CMYK color space for optimal printing. Color swatches are global so it’s easy to edit and change the colors.
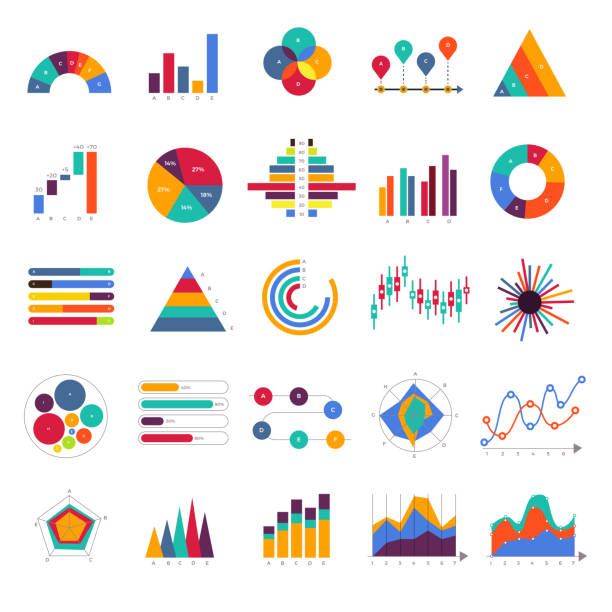
Statistics - line icon set. Collection of 20 graphs, charts, diagrams...
of100Next