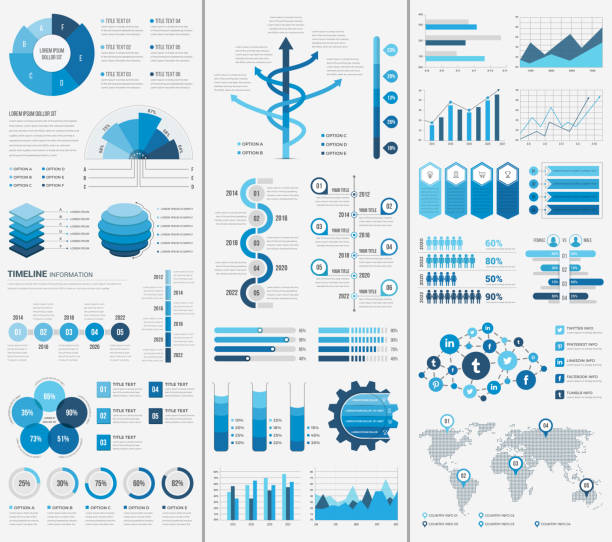
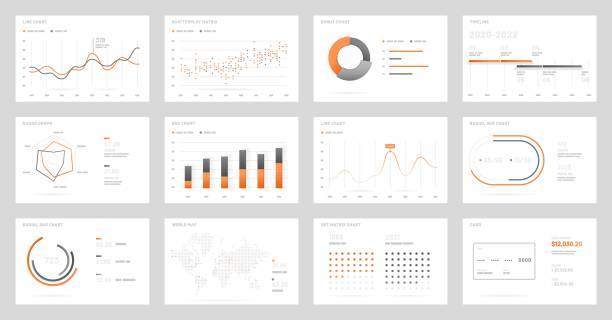
Infographic elements for business layout, presentation template, flyer, leaflet and corporate report. UI and UX Kit with big data visualization.
Browse 7,200+ line-chart-infographic stock illustrations and vector graphics available royalty-free, or start a new search to explore more great stock images and vector art.
Infographic elements for business layout, presentation template, flyer, leaflet and corporate report. UI and UX Kit with big data visualization.
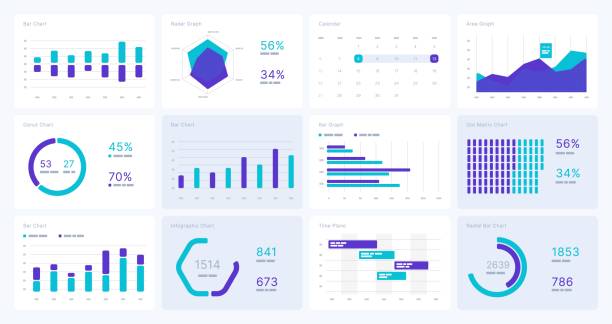
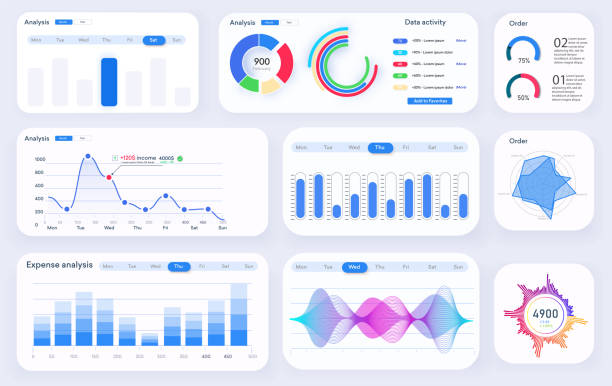
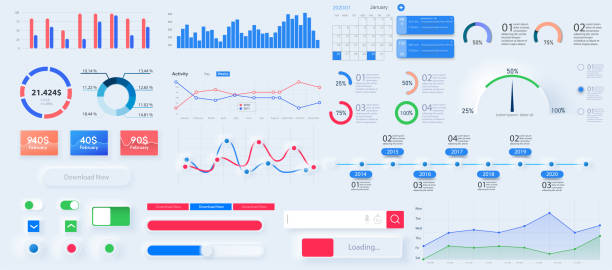
Modern infographic template with statistics finance charts. Infographics dashboard. Admin panel interface with color charts, graphs on white background. Illustration flowchart and diagram and workflow
Big set of infographic tools. Use in presentation templates, mobile app and corporate report. Dashboard UI with big data visualization.
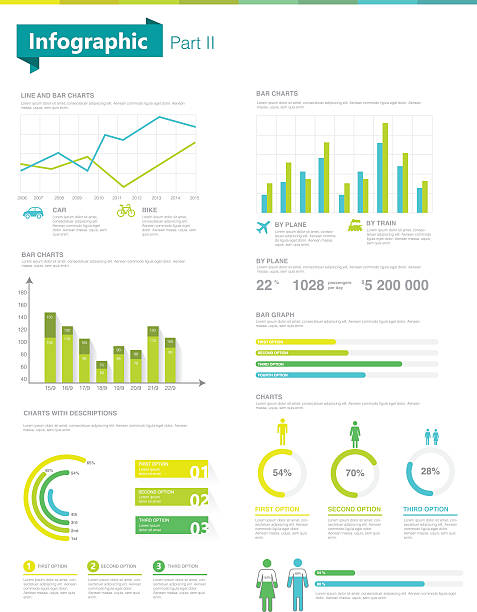
Information Graphics and charts, vector illustration. Bar Graph, Line Graph, Chart, Data, Web Page
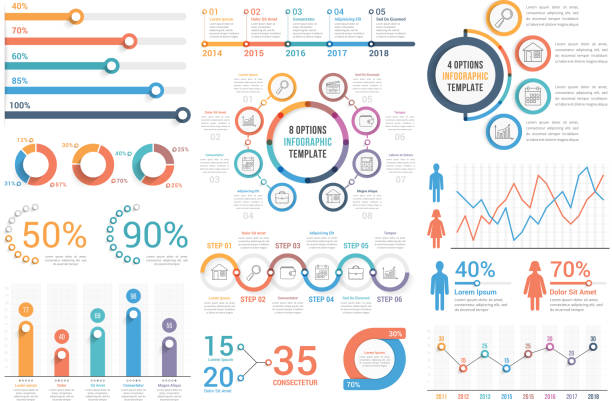
Infographic elements - bar and line charts, percents, pie charts, steps, options, timeline, people infographics, vector eps10 illustration
Infographic elements. Use in presentation template, flyer, leaflet and corporate report. UI and UX Kit with big data visualization.
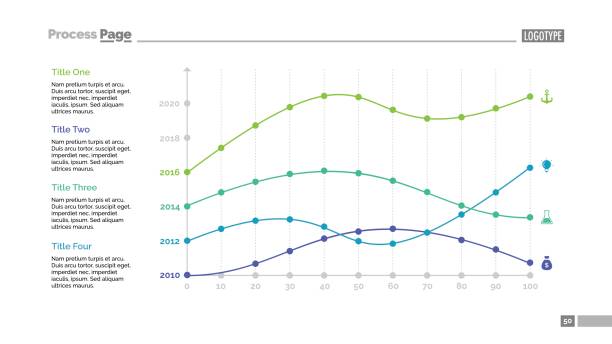
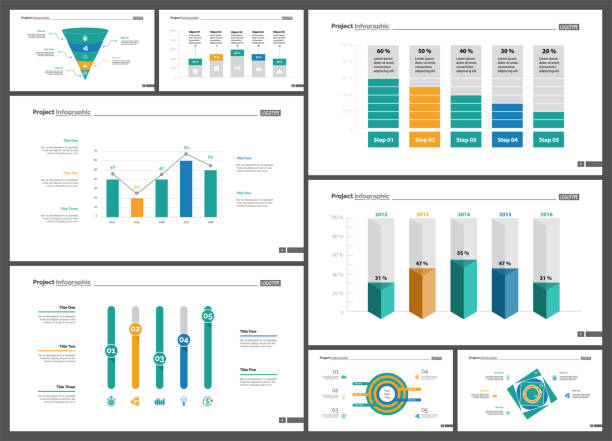
Four line charts slide template. Business data. Graph, diagram. Creative concept for infographic, report. Can be used for topics like statistics, analysis, research.

Bar graph and line graph templates, business infographics, vector eps10 illustration
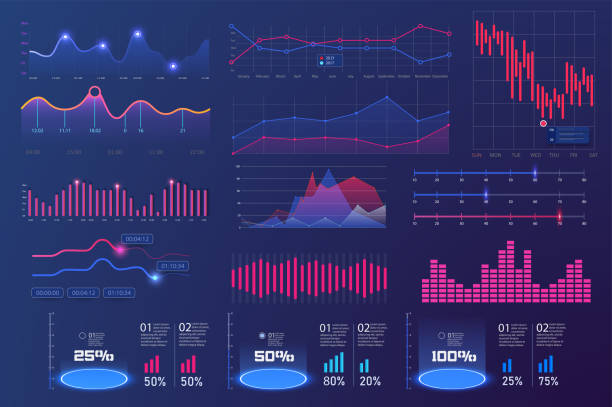
Bundle infographic UI, UX, KIT elements. Modern infographic dashboard, financial statistics and analytics progress scale panel,control diagram, digital display screen.

realistic vector abstract 3d paper infographic elements
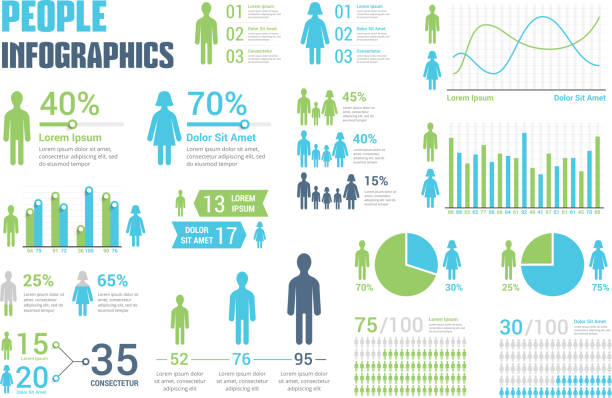
People infographics for reports and presentations - percents, bar and line graphs, pie charts, vector eps10 illustration
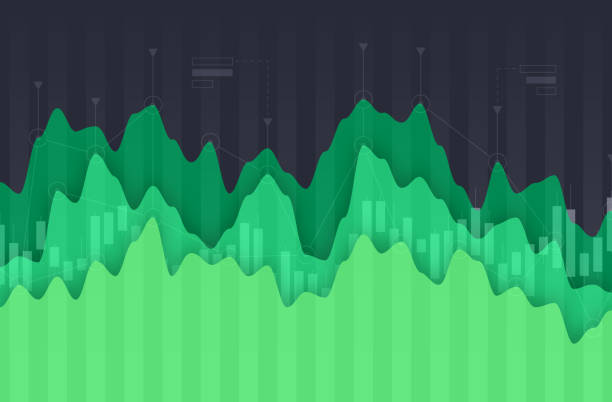
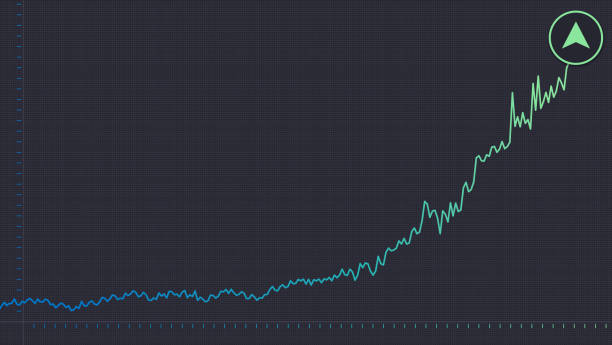
Chart financial asset movement abstract lines background design with space for your copy.
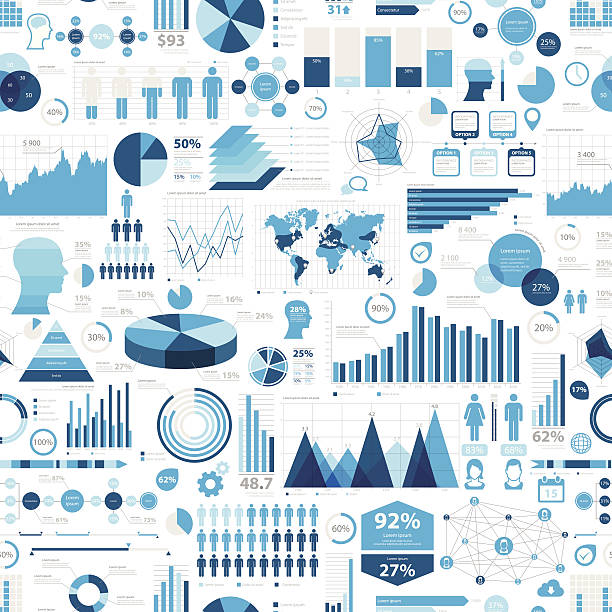
Infographic background with different elements like charts, pie charts, diagrams, time lines,...
Stock trading commodity chart graph illustration.
Business infographic design set for strategy concept. Can be used for business project, annual report, web design. Process chart, option chart, flowchart, scatter plot, line graph
Web dashboard, great design for any site purposes. Business infographic template. Vector flat illustration. Dashboard user admin panel template design.

Four line charts slide template. Business data. Graph, diagram. Creative concept for infographic, report. Can be used for topics like statistics, analysis, research.

This infographic set is designed to help you to produce presentations, re-use graphics for compare different products, for your graphic inspirations and many more.

Infographic background with different elements like charts, pie charts, diagrams, time lines,...

Laptop Illustration With Financial Charts and Graphs Screen. Easy editable EPS file.

Abstract financial background with uptrend line, textured graphs, charts and copy space. Editable vectors on layers.

Scientific discoveries demonstration infographic chart design template set for dark theme. Visual data presentation. Bar graphs and circular diagrams collection. Myriad Variable Concept font used
Vector line icon set appropriate for web and print applications. Designed in 48 x 48 pixel square with 2px editable stroke. Pixel perfect.

Stock market commodity chart financial analysis graph.

Science and data abstract tech background.
This is Infographic Elements. It can be used in almost every project.

Mobile app infographic template with modern design weekly and annual statistics graphs, UI/UX, admin. Screens with data analysis and statistics.

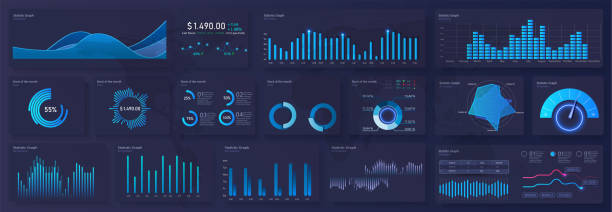
Big set of infographics on a dark background. Use in presentation templates, mobile app and corporate report. Dashboard UI with big data visualization.
Big set of infographic tools. Use in presentation templates, mobile app and corporate report. Dashboard UI with big data visualization.
Modern modern infographic vector template with statistics graphs and finance charts. Diagram template and chart graph, graphic information visualization

Infographic template for business. 12 Months Modern Timeline diagram calendar with Gantt chart, presentation vector infographic.
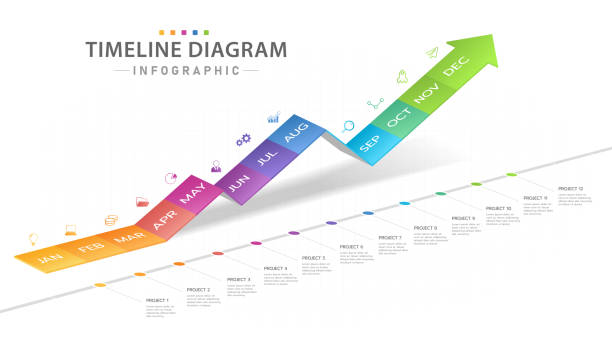
Infographic template for business. 12 Months modern Timeline diagram calendar with growth graph, presentation vector infographic.
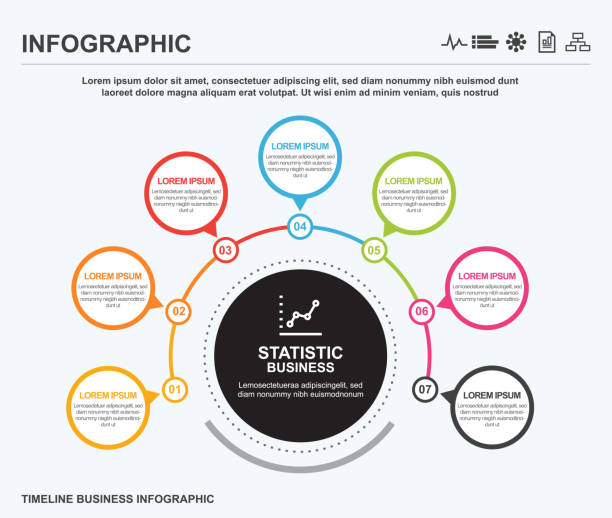
Business world circle infographic, infographic, business, timeline, icon

3D Paper Infographics, chart with long shadows. Vector Illustration

Three line charts slide template. Business data. Graph, diagram. Creative concept for infographic, report. Can be used for topics like statistics, analysis, research.

Infographic elements - bar and line graphs, process, steps, options, people infographics, pyramid, percents, vector eps10 illustration

This is Infographic Elements. It can be used in almost every project.
Infographic template for business. 6 Steps Modern Timeline diagram with arrow and topic, presentation vector infographic timeline.
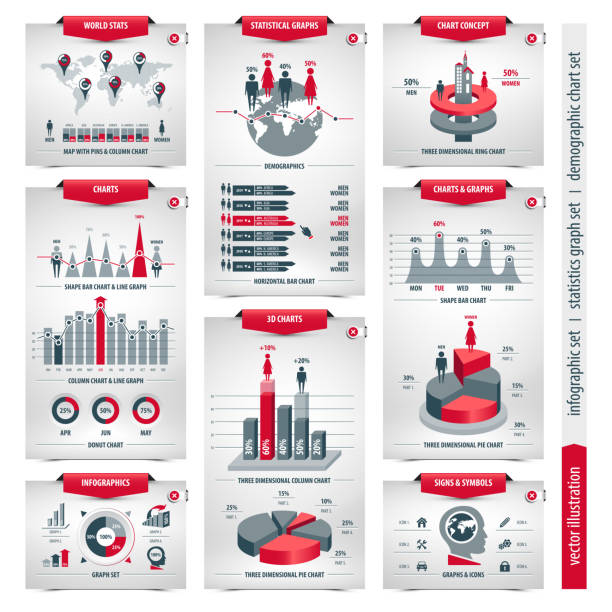
vector set of infographic elements containing population demographics design, business statistical line graphs with icons, 3d column, pie, shape bar and ring charts, isolated forms on white background

Abstract business background with copy space. Textured striped financial graphs. Editable vectors.
Infographic dashboard template with flat design graphs and pie charts. Information Graphics elements for web design. Web elements in moden style.
20 Outline Style - Black line - Pixel Perfect icons / Set #39 / Infographics / Icons are designed in 48x48pх square, outline stroke 2px. First row of outline icons contains: Projection Screen with growing arrow, Flow Chart, Planning Chart, Organization Chart, 3D Pie Chart; Second row contains: Moving Down Chart, Diagram, Pyramid Chart, Alphabetical Order, Moving Up Chart; Third row contains: Triangle Report Chart, Data line Chart, Circle Report Chart, Line Graph Chart, Financial Report Chart; Fourth row contains: Bar Graph Chart, Multi - Layered Effect, Spreadsheet, Pie Chart, Dashboard Chart. Complete Primico collection - https://www.istockphoto.com/collaboration/boards/NQPVdXl6m0W6Zy5mWYkSyw

Elements of infographics on a black background. Use in presentation templates, mobile app and corporate report. Dashboard UI and UX Kit with data visualization.
Increasing value cryptocurrency stock commodity price value chart increase with space for your copy.

Stocks buying and selling of commodities or cryptocurrency value chart with space for your copy.

9 infographic templates, set 1, colors 1 - timelines, bar and line charts, pyramid, pie chart, percents, steps/options, circle diagram, vector eps10 illustration

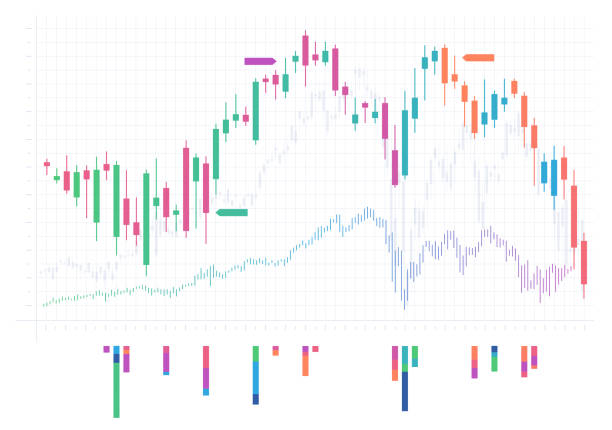
business growth graph stock commodity candlestick Trend Graph,Financial graph data, profit trend vector illustration.