
Natural killer cells are immune cells that recognize ligands such as viral proteins on the surface of infect cells and mount an immune response to remove them from circulation.
Browse 130+ cell death stock illustrations and vector graphics available royalty-free, or search for cancer cell death to find more great stock images and vector art.
Natural killer cells are immune cells that recognize ligands such as viral proteins on the surface of infect cells and mount an immune response to remove them from circulation.
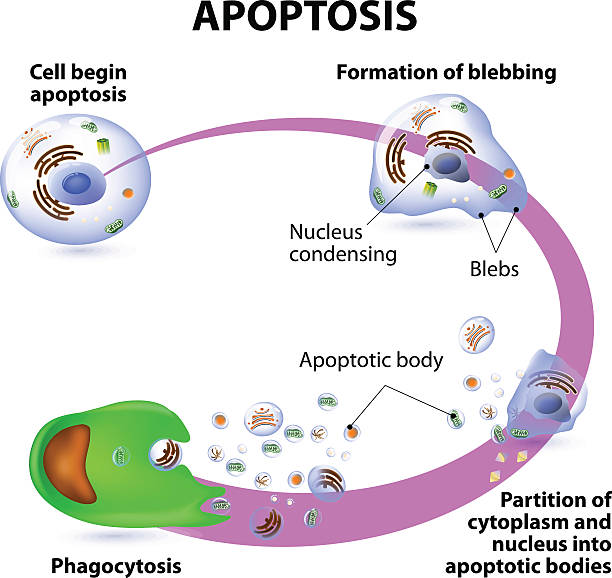
Apoptosis is the process of programmed cell death. Vector diagram

Apoptosis. Programmed cell death. Caspases. Cellular homeostasis. Cell fragmentation. Apoptotic bodies for Phagocytosis. Vector. Schematic diagram. Detailed poster.

Apoptosis (chromosome condensation, nuclear fragmentation), autophagy (autophagosome formation), necrosis (membrane rupture, organelles swelling)
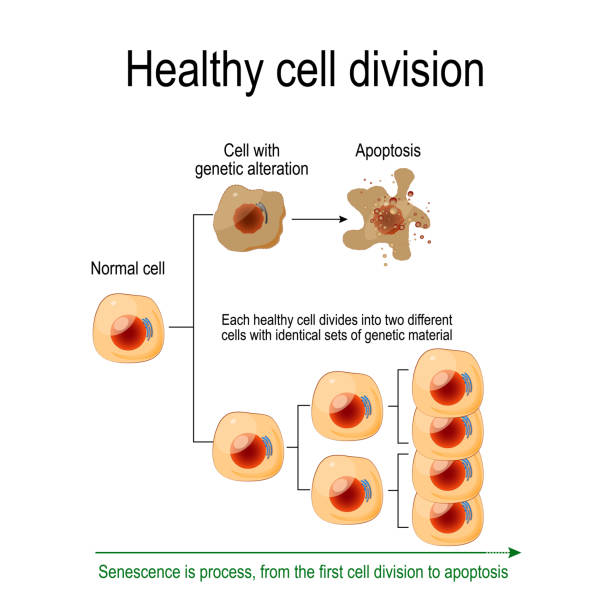
Healthy cell division. Each healthy cell divides into two different cells with identical sets of genetic material. Senescence is process, from the first cell division to apoptosis. Vector diagram for your design, educational, science and medical use

Apoptosis or Necrosis. Difference between necrotic death of a cell, and apoptosis of a cell. Comparison of the premature death of cells and programmed death. Morphological changes. Vector poster. Isometric Flat illustration.

Apoptotic versus necrotic morphology. Apoptosis and necrosis is a form of cell death. Structural changes Of cells undergoing necrosis or apoptosis. Schematic Representation Of The Process Apoptosis and necrosis. Apoptosis is triggered by normal, healthy processes in the body. Necrosis is cell death that is triggered by external factors or disease, such as trauma or infection.
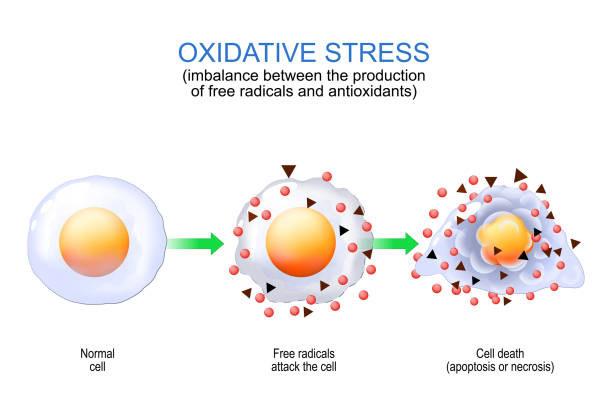
Oxidative stress. imbalance between the production of free radicals and antioxidants. From Normal cell to attack of Free radicals and Cell death by apoptosis or necrosis. Vector poster for education.

Apoptosis process stages as programmed cell death explanation in labeled outline diagram. Multicellular organisms destruction steps example with educational microscopic closeup vector illustration.

Cancer development. Normal cells are transformed into cancer. Carcinogenesis from Genetic mutations in healthy cell to Malignant cancer cells. Mutagenesis, Oncogenesis or tumorigenesis. Tumor formation. Vector illustration.

Chromosome of a Normal fibroblast and Cell senescence. Telomeres shorten with each round of replication. aging process. Vector poster

cellular senescence. From Normal to Senescent cell. Telomere and DNA damaged, mitochondrial dysfunction are primary drivers of damage in aging. Anti-aging therapy. Senescence-associated secretory phenotype SASP. Anti aging medicine. vector poster

DNA damage. Free radical formation. Oxidative stress. DNA can be damaged via UV light, ionizing radiation, Air pollution, Inflammation, and Smoking. Aging process. Cell death. Cancer development. infographics. Vector poster. Isometric Flat illustration.

Myocarditis. inflammatory cardiomyopathy. Cross section of a human heart and Myocardium. Close-up of a Normal myocytes, Damaged myocytes and inflammatory immune cells. acquired cardiomyopathy due to inflammation of the heart muscle. Vector illustration

Function of mitochondria. Mitochondria convert food energy into energy for biological processes like Inflammation, ATP production, Immunity regulation, Calcium homeostasis, Senescence of cell, Stem cell regulation and Apoptosis. Vector illustration

3D Isometric Flat Vector Conceptual Illustration of Neutrophil, Educational Scheme
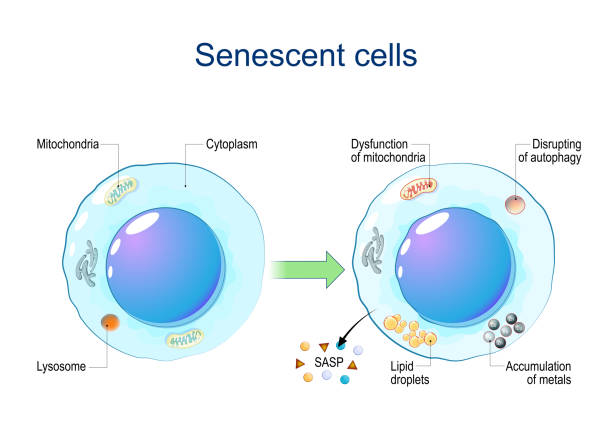
Senescent cells. Cellular senescence from Dysfunction of mitochondria, accumulation of metals, Disrupting of autophagy, Lipid droplets to release of Senescence-associated secretory phenotype SASP and chronic inflammation. DNA damage response. Aging cells. Vector diagram

A telomere is a repeating sequence of double-stranded DNA located at the ends of chromosomes. Each time a cell divides, the telomeres become shorter. Eventually, the telomeres become so short that the cell can no longer divide.

Cell death types: general differences between cell death processes, including common necrosis, autophagy, apoptosis and specific entosis, paraptosis and ferroptosis.

3D Isometric Flat Vector Illustration of Autophagy, Diagram of the Process

Necrosis. Premature Uncontrolled cell death. Cell membrane rupture and Cell fragmentation. Phagocytosis. Vector. Schematic diagram. Detailed poster.

Cytotoxic T cell. Cell-mediated immunity. Through the action of perforin, granzymes from T cell enter the cytoplasm of the infected cell, and lead to apoptosis and cell death. Vector. Schematic diagram. Detailed poster.

Cancer evolution from Mutated cell and Hyperplasia, to Dysplasia and Malignant tumor. Spread cancer cells to other tissues. Vector diagram

A telomere is a repeating sequence of double-stranded DNA located at the ends of chromosomes. Each time a cell divides, the telomeres become shorter. Eventually, the telomeres become so short that the cell can no longer divide.

Autophagy process. From forms a double membrane and autophagosome formation to Autophagosome fuses with a lysosome and Degradation of cellular component. Cell recycling. Cancer therapy and Immune regulation. Cell organelles. vector illustration isolated on white background.

glycolysis. Warburg effect. Metabolism in the Normal cell and Cancer cell. Tumor cells have higher levels of glycolysis and lactate production

DNA damage. DNA can be damaged via UV light, ionizing radiation, genotoxic chemicals, free radicals, and replication errors. Aging process, Cell Apoptosis and cancer development

Carcinogenesis. Oncogenesis stages. Normal cells are transformed into cancer cells. Process of tumorigenesis. genetic and epigenetic mutations, abnormal cell division, Cancer development, tumor spreads and Metastasis. Vector poster

Lysis is breaking down of the membrane of a cell. Virus, enzyme, drop of fluid, and lysate. healthy cell and lysed cell.

Cancer and cytotoxic T-cells. T lymphocyte kills cancer cells. T-cell (immune responses), release the perforin and granzymes, and attack cancerous cells. Through the action of perforin, granzymes enter the cytoplasm of the target cell, and lead to apoptosis (cell death

Function of mitochondria. Regulation of immunity and cellular proliferation, Calcium balance, Heat production, Energy conversion. Mitochondrial medicine. Vector poster. Isometric Flat illustration.

The wound healing process. Cutaneous wound after injury

Hallmarks of aging. Chromosomes with Telomeres before and after division of new and senescent cell. Cell division will cease once telomeres shorten to a critical length. Cellular aging. Vector illustration

Mitochondrial dysfunction. Vector illustration. Medical poster. Schematic diagram

Oxidative stress from healthy cell to cell death. Apoptosis or necrosis. Imbalance between the production of free radicals and antioxidants. Vector illustration. Medical poster. Schematic diagram

Cellular senescence. Functions of the SASP. Senescence-Associated Secretory Phenotype. changes senescent cells During ageing. spread the senescence phenotype in a paracrine manner to surrounding cells. Vector illustration

Cancer treatment. Cancer cell and DNA with Suicide gene. Cell before Suicide gene therapy and apoptosis. Antitumor immunity. Clinical trials. Programmed cell death. vector illustration

B cell activation diagram. Process of recognizing an antigen and binds to it. Bidirectional activation signals. Allergic diseases concept. Human immune system medical flat vector illustration.
FAST stroke symptoms concept icon. Typical signs of stroke idea thin line illustration. Facial drooping, arm weakness and speech difficulty. Vector isolated outline RGB color drawing. Editable stroke

Cytolysis. Osmotic lysis. Water enter the cell and causes its volume to increase to the point where the volume exceeds the membrane's capacity and the cell bursts. Vector diagram for educational, medical, biological and science use

Mitochondrial aging from birth to lysis. Aging process from young cell organelle to autophagosome fuses with a lysosome. The Life Cycle of a Mitochondrion. Mitochondrial senescence, structural changes over time. Vector illustration. Medical poster. Schematic diagram

Neutrophil vector illustration. Medical educational scheme with labeled capillary, circulation, adherence, deformability, chemotaxis and phagocytosis. Apoptosis and microorganisms icroscopic closeup.

Thyroid cancer vector illustration in white background.

Cells of immune system that killing of cancer cell. Tumor targeting cells. Immune Response and Cancer therapy. Immunotherapy. Vector diagram

Mitophagy. Autophagy process from Defective mitochondria to Autophagosome fuses with a lysosome. Cell recycling. mitochondrial quality control. Detailed Vector poster
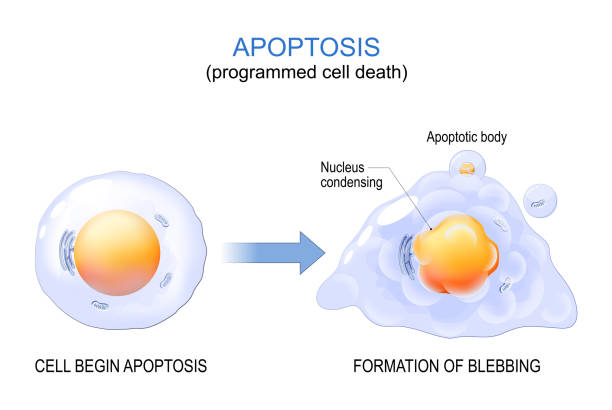
Apoptosis. programmed cell death. aging process in cells. Structural changes of ageing and senescent cells from normal cell to final stage of formation of membrane blebbing. Vector illustration

Ceramide molecule , is composed of sphingosine and a fatty acid. Structural chemical formula. Vector illustration

Cellular senescence. hronic inflammation process. Progresses from initial triggers, senescent cell, SASP, leading to the conversion of normal cells into inflammation-promoting cells. Vector illustration

Phagocytosis. Macrophage recognition of pathogens, followed by endocytosis, digestion involving lysosome and vacuole fusion, and exocytosis of debris. Immune system. Innate immunity. White blood cells. Microbial killing. Detailed Vector poster

3D model of a protein molecule. Endothelial tyrosine kinase receptor, a marker of angiogenesis.


