Bar chart slide template. Business data. Graph, diagram. Creative concept for infographic, templates, presentation, report. Can be used for topics like analysis, statistics, finance.
Browse 50,500+ bar chart infographics stock illustrations and vector graphics available royalty-free, or start a new search to explore more great stock images and vector art.
Bar chart slide template. Business data. Graph, diagram. Creative concept for infographic, templates, presentation, report. Can be used for topics like analysis, statistics, finance.

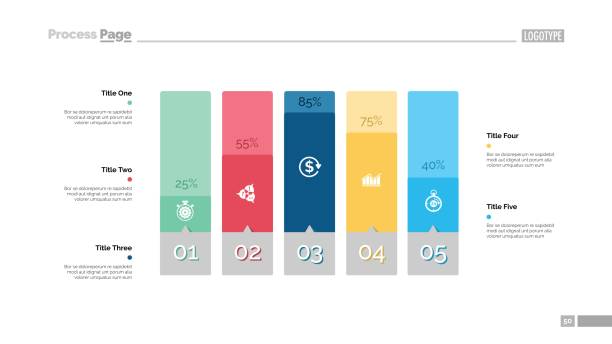
Business presentation page design set can be used for annual report, web design, workflow layout. Analysis concept. Process cart, flowchart, donut, pie graphs, organizational chart, bar graph
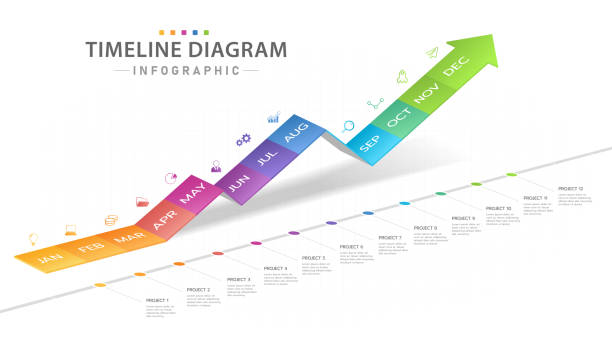
Infographic template for business. 12 Months modern Timeline diagram calendar with growth graph, presentation vector infographic.

Graphs and charts templates for statistics or data visualization, set of 9 infographic templates for reports and presentations, vector eps10 illustration
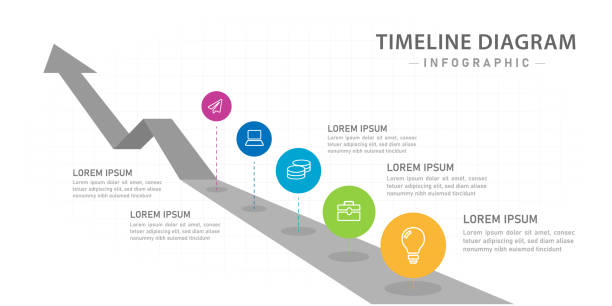
Infographic template for business. 5 Steps Modern Timeline diagram with roadmap and circles.

Abstract business background with copy space. Textured striped financial graphs. Editable vectors.

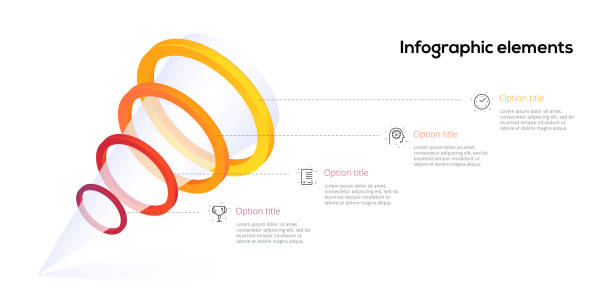
Six infographic templates for web, business, presentations - steps, options, funnel diagram, bar graph, vector eps10 illustration

Vector infographic design elements. Presentation template.
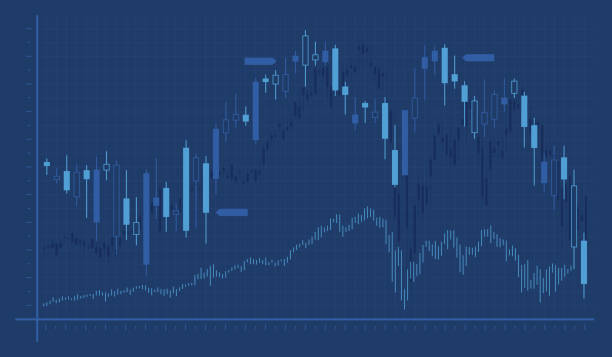
Stock trading commodity chart graph illustration.
20 Outline Style - Black line - Pixel Perfect icons / Set #46 Icons are designed in 48x48pх square, outline stroke 2px. First row of outline icons contains: Organization Chart, Financial Report, Cloud Computing, Bar Graph, Brainstorming; Second row contains: Moving Down Chart, Bar Graph Chart, Dashboard Chart, Analyzing Chart, Moving Up Chart; Third row contains: Mobile Phone and Graph, Laptop Chart, Separating Funnel, Clipboard and Pie Chart, Network Server; Fourth row contains: Calculator, Gears icon, Magnifying glass and Chart, Flask and Check mark, Conference. Complete Primico collection - https://www.istockphoto.com/collaboration/boards/NQPVdXl6m0W6Zy5mWYkSyw
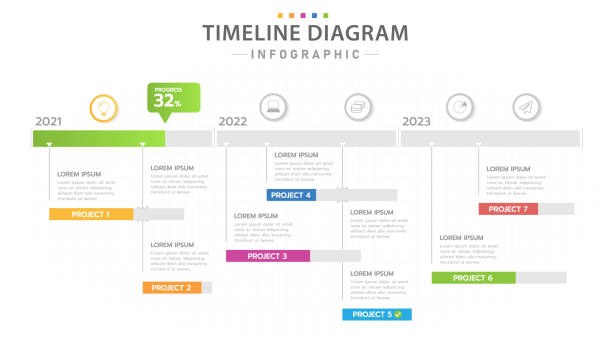
Infographic template for business. Modern Timeline diagram calendar with 3 years Gantt chart, presentation vector infographic.

Coronavirus cell (COVID-19, 2019-nCoV) with a big set of infographic elements. This large selection of modern elements includes charts, pie charts, diagrams, demographic graph, people graph, datas, time lines, flowcharts, icons... (Colors used: red, green, turquoise blue, black). Vector Illustration (EPS10, well layered and grouped). Easy to edit, manipulate, resize or colorize.
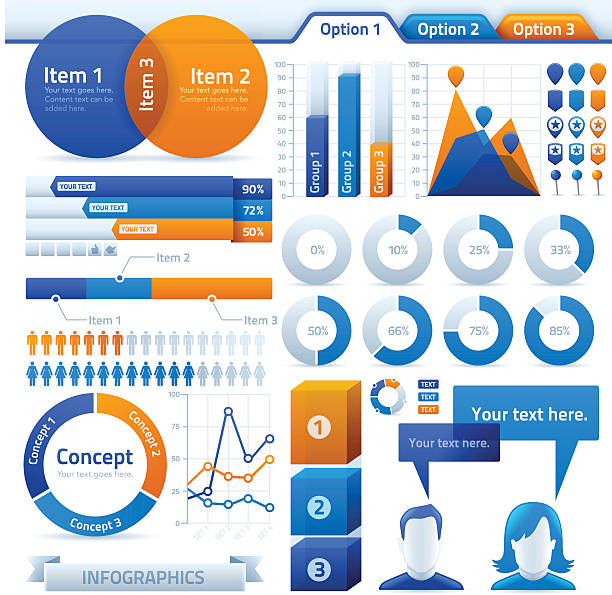
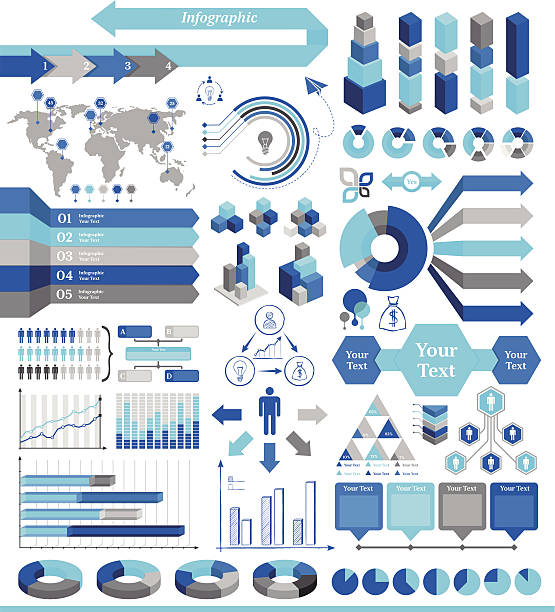
Highly detailed infographic and design elements. Elements are grouped and labeled for easy adjustment. EPS 10 file. Transparency effects used on highlight elements.

Six infographic templates for web, business, presentations - process charts, circle diagrams, pyramid, bar graph, vector eps10 illustration

Rectangular bar infographic template or element with 7 step, process, option, colorful circle, button, hierarchy, tag, minimal style for sale slide, flowchart, workflow, stock trading, financial, web

Infographic design template. Business concept with 6 columns. Vector illustration
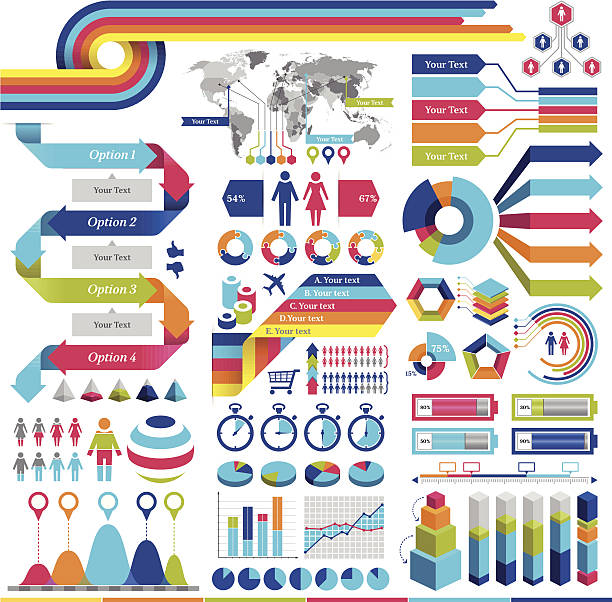
Infographics design elements vector illustration – easy to edit, manipulate and colorize.

Inforgraphic diagram design set can be used for business project, for annual report, web design. Startup concept. Option chart, process chart, timeline, donut chart, bar graph, percentage diagram

A comprehensive Template set for infographics. - Bar charts - Graphs - Pie Charts - Detailed World Map - Pointer Icons - Story Line Templates Vector file is EPS v.10 and is organized with layers, isolating all elements on its own layers.

Modern infographic option banner with colorful city bar chart. Vector. Can be used for workflow layout, banner, diagram, web design, infographic template.

A set of modern and simple infographic design elements with minimal shadow effects. Each element is grouped individually.

Infographic elements - bar and line graphs, process, steps, options, people infographics, pyramid, percents, vector eps10 illustration

Vertical bar chart. Business data. Percentage, diagram. Creative concept for infographic, templates, presentation, report. Can be used for topics like analysis, accounting, finance.
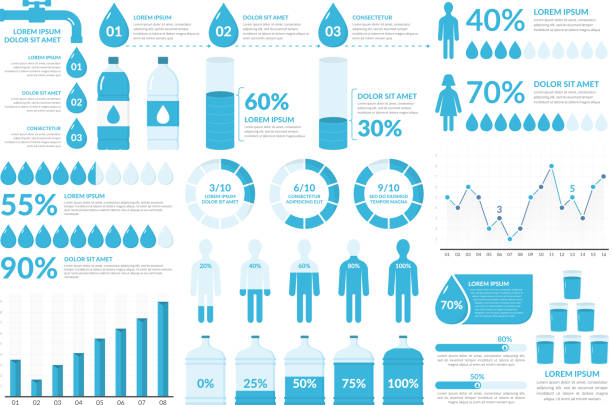
Water infographic elements - drops, bottles, people, graphs, percents, vector eps10 illustration

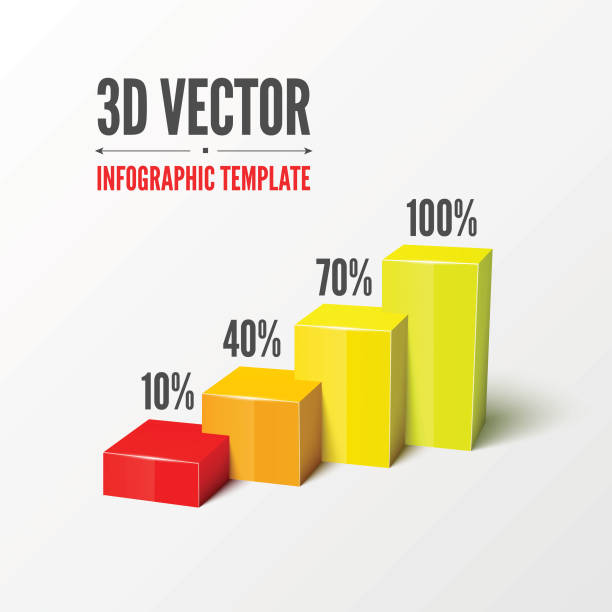
3D infographic of increasing growth graph bar. Vector graphic design
A set of twenty-five square flat design icons with long side shadows. File is built in the CMYK color space for optimal printing. Color swatches are global so it’s easy to edit and change the colors.

Statistics data and analytics data analysis software laptop with bar graphs, pie charts and data information.

Five columns bar chart. Business data. Comparison, diagram. Creative concept for infographic, templates, presentation, report. Can be used for topics like analysis, accounting, research.

infographic, icon, business, step, timeline
Vector infographic or web design template for your design
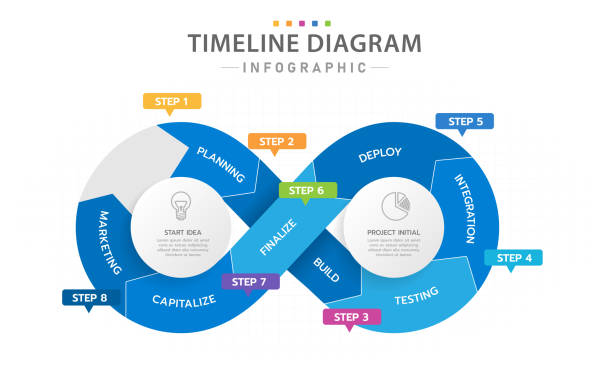
Infographic template for business. 8 Steps Modern Cycle Timeline diagram with project planning, presentation vector infographic.

Public administration infographics with icons set and copyspace

A set of modern rectangular infographic elements. EPS 10 file, with transparencies, layered & grouped,

Creative presentation label design for infographics in 5 steps. Horizontal option banner. Graphic resource elements suitable for workflow, annual report, graph, layouts, brochure, business report.
Five columns bar chart. Business data. Percentage, diagram. Creative concept for infographic, templates, presentation, report. Can be used for topics like analysis, accounting, research.

Vector illustration of Casual Graphic Bar Infographic design element.

Easy editable vector 7 options infographic design, bar chart, presentation template. Global swatches.

Big set of infographics on a dark background. Use in presentation templates, mobile app and corporate report. Dashboard UI with big data visualization.

Vector infographic elements. AI CS5, EPS 10 and JPG.

Business infographic element. Ladder of progress, career growth, financial success, consisting of 5 steps, with an arrow tending upward. 3 D.