Abstract Medical Sciences infographics presentation set with icon in white color background
Images
Browse 266,900+ data chronology stock photos and images available, or start a new search to explore more stock photos and images.
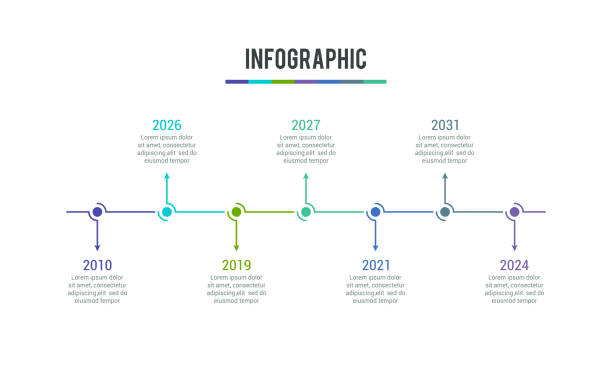
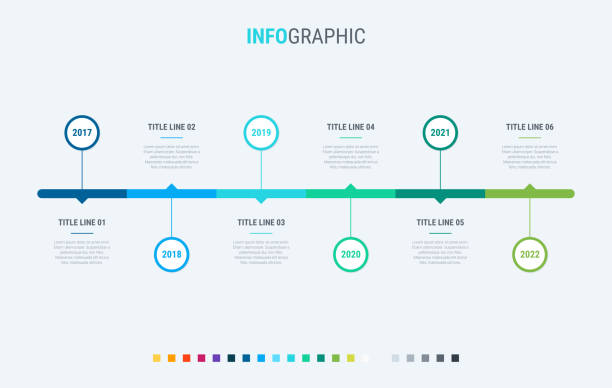
Vector illustration of business infographic for company milestones timeline template with years.
Business data visualization. timeline infographic icons designed for abstract background template milestone element modern diagram process technology digital marketing data presentation chart Vector

Our creative library is free of AI-generated contentChoose your visuals with confidence knowing our creative library is free from AI-generated content, so your searches only return safe, high-quality visuals you can trust.

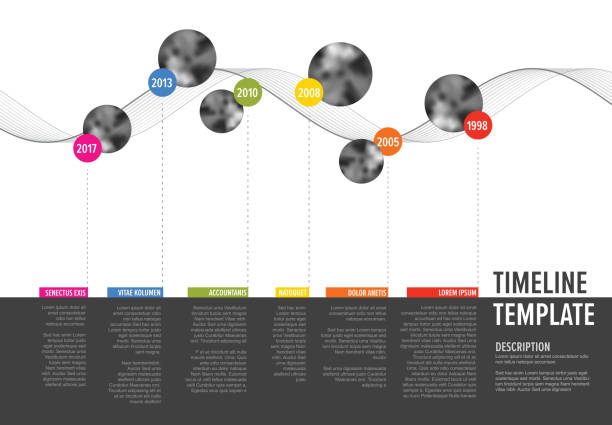
Thin line timeline minimal infographic concept with six periods of time. Vector template for web, presentations, reports, visualizations. Editable stroke.

Charts and graphs, business statistic diagram infographic. Business stock market information, finance presentation, report, with financial data elements. Marketing, analysis, investment data info, 3D mixed media illustration

Businessman's hand analyzing gantt chart on laptop over reflective desk

Digital countdown clock counter timer, coming soon or under construction web site page time remaining count down, vector illustration

Vector illustration of the infographic elements, timelines.

Vector illustration of the infographic elements, timelines.
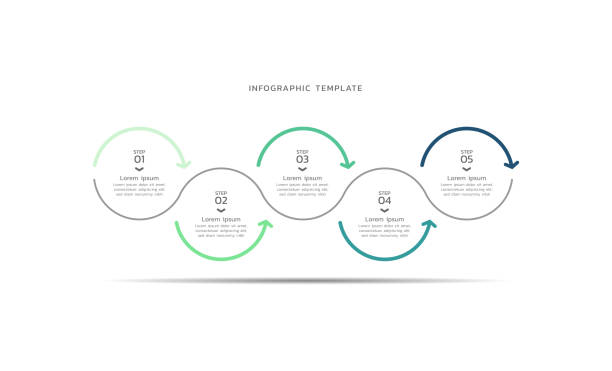
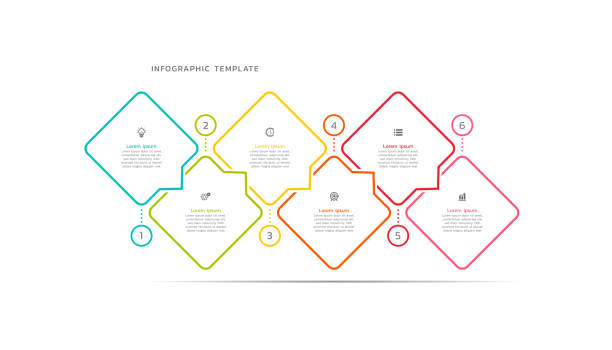
Professional infographic template business design

Vector illustration of the infographic elements.

Successful mature asian working inside office using laptop, man typing on keyboard and smiling, businessman in shirt and glasses satisfied with work and achievement results, programmer at work.

Infographic template for business. 5 Level Modern Sales funnel diagram, presentation vector infographic.

4k tech lines and dots three dimensional glitter background
Vector illustration of the infographic elements, bar chart, circle diagram, timeline.


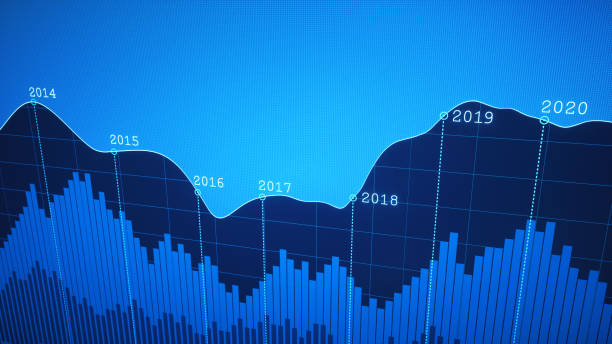
A simple financial report showing a graph line plotted on a dark blue pixilated background.
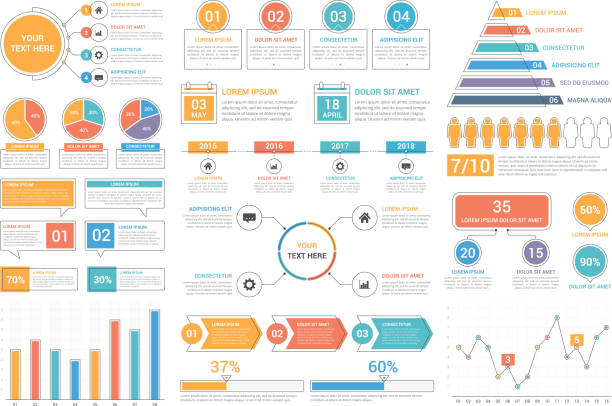
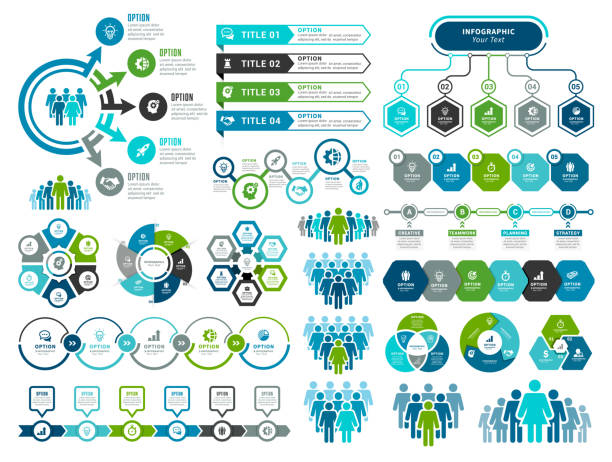
Infographic elements - bar and line charts, percents, pie charts, steps, options, timeline, people infographics, vector eps10 illustration

Visual representation of a flowing data stream in a seamless digital aesthetic showcasing interconnected points and smooth curves. Highlights the concept of data, network, and communication in a modern context.


Time compression and supply chain outline vector concept with mono stroke graphic design. Premium quality illustration can be used for web, mobile banners and infographic design.


http://www1.istockphoto.com/file_thumbview_approve/17401820/2
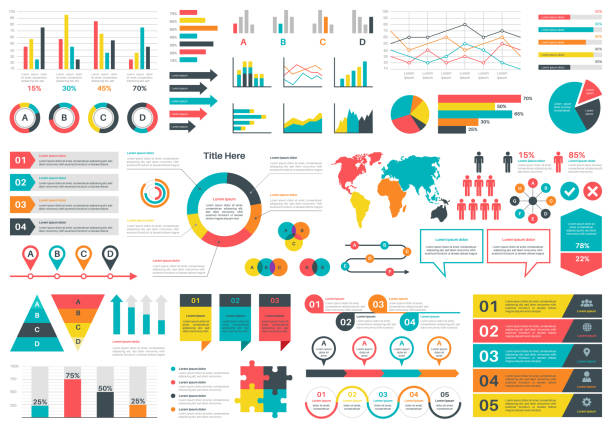
Infographics charts. Financial analysis data graphs and diagram, marketing statistic workflow modern business presentation elements vector investment progress icon set
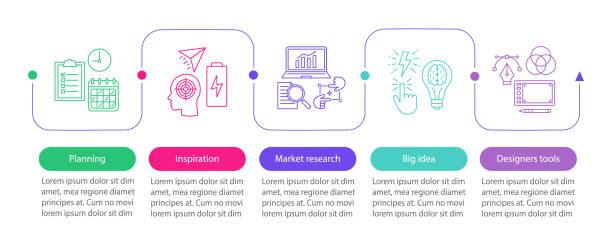
Graphic design development vector infographic template. Planning, inspiration, market research, tools. Data visualization with five steps and option. Process timeline chart. Workflow layout with icons

Data tunnel abstract vector background. Security tunnel protected data flow. Network code security
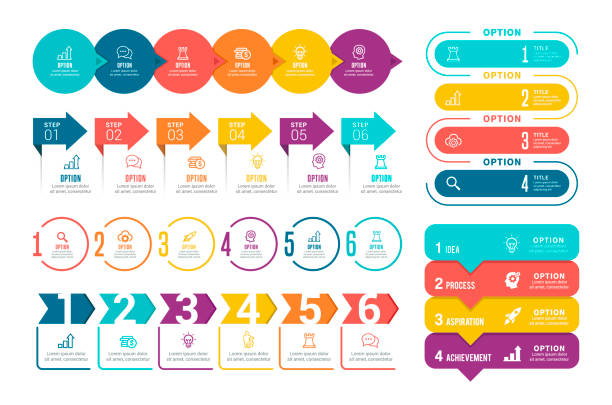
Steps infographics business colorful elements design

Futuristic speed lights technology data abstract background.
Simple Set of Database Related Vector Line Icons. Contains such Icons as Backup, Structure, Data Transfer and more. Editable Stroke. 48x48 Pixel Perfect.

Project management team updating Gantt chart schedule or planning on computer, two business people in office


London, England, data over Bank of England and Lloyds of London, office buildings & executives.


Abstract digital background with glowing sparkling particles points and streaks. Technology background concept. Big data abstract background. Vector illustration
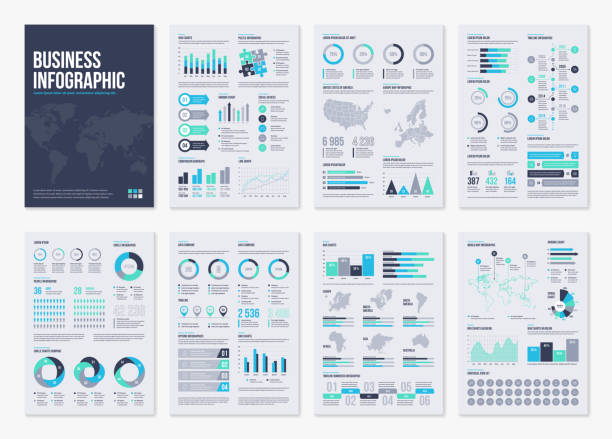
Infographic brochure elements for business data visualization. Vector illustration in modern flat info graphic style.


Abstract business circle infographic template with 6 steps. Colorful diagram, timeline and schedule isolated on light background.

Technology Configuration Line Icon. Gear, Computer, Tool, Speech Bubble Digital Setting Concept Pictogram. Innovation Business Process Outline Icon. Editable Stroke. Isolated Vector Illustration.


Picture female hand touching modern tablet.Investment manager working new private banking project office.Using electronic device. Graphic icons, worldwide stock exchanges interface on screen.

Isometric infographic charts and diagrams. Vector abstract analysis and statistic graphs, timelines. Design elements of digital report for finance, investment or another data on purple background


Time concept: pixelated Clock icon on digital background, 3d render


Female project manager using Gantt chart schedule to organize tasks and update planning on computer screen with software


Abstract flow of data in cyber wormhole. Quantum computing information vortex. Digital singularity


Vector illustration of the infographic elements, timelines.