Images
Schema Pictures, Images and Stock Photos
View schema videos
Browse 1,500+ schema stock photos and images available, or search for schema therapy or schema icon to find more great stock photos and pictures.
Most popular

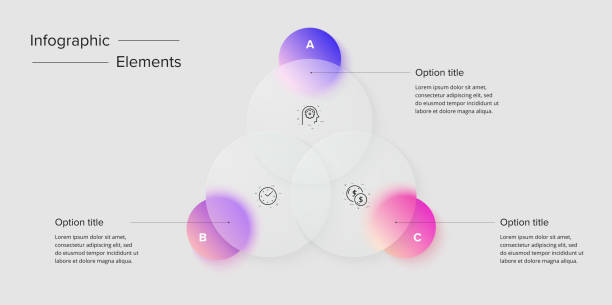
Vector multipurpose Infographic template with title and four semi transparent elements options and modern colors on a dark gray background

Venn Diagram Colored. Three Intersected Circle Schema. Circular Empty Chart. Modern Diagram Venn. Round Analysis Graphic Template for Management. Framework Infographic. Isolated Vector Illustration.

Simple timeline template made of rainbow color thick line segments. Multipurpose infochart template displaying main milestones or important stages on diagonal path.
Our creative library is free of AI-generated contentChoose your visuals with confidence knowing our creative library is free from AI-generated content, so your searches only return safe, high-quality visuals you can trust.

Weather change page template. Legal format. The font is drawn.

Agile management and develop process infographic. Work sprint cycling diagram, scrum metod in project. Agility style working vector icon of software agile development process business illustration
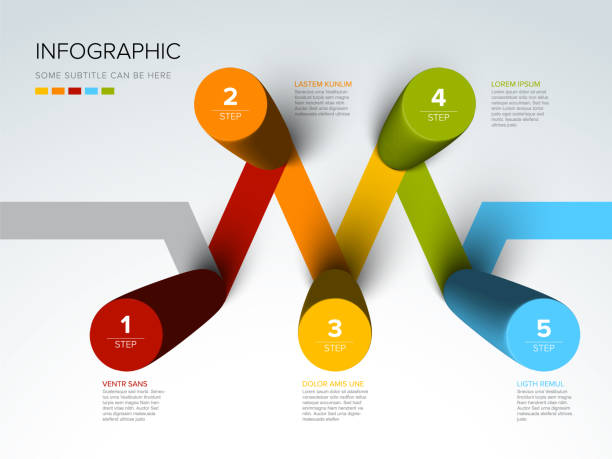
Vector light multipurpose Infographic template made from color diagonal cylinder steps chart with numbers descriptions color stripes and legend - white background version with 5 steps elements
Simple visualization for profit, risk and loss with colorful circles and line icons with white accent. Easy to use for your design or presentation.

A visually appealing 3D layered infographic with six gradient blocks connected to text descriptions. Clean, modern design perfect for presenting hierarchical or categorized data visually.
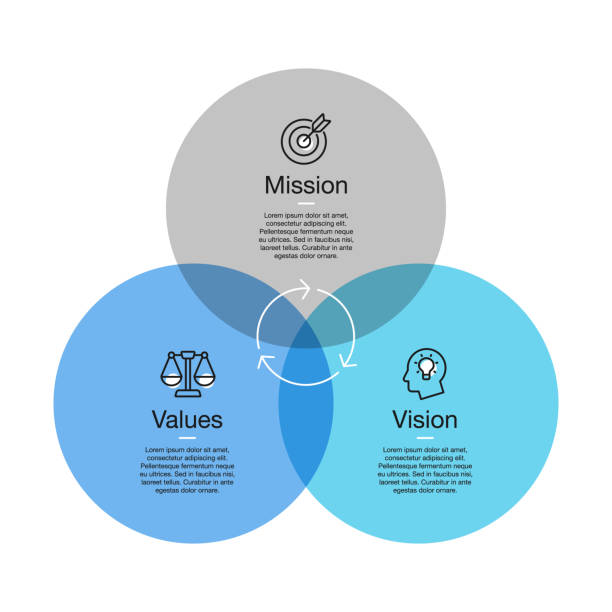
Simple visualization for mission, vision and values diagram with colorful circles and line icons with accent. Easy to use for your design or presentation.


Body set front and back acupuncture scheme with points. Human body with Anterior and posterior meridians phase chart vector medical illustration. Traditional Chinese medicine.

Vector light multipurpose Infographic template with title and five blue elements options with big color arrows. Multipurpose Infochart with modern colors lines icons and pyramid triangle arrows pointing on various directions


Vector multipurpose Infographic template made from seven curves, icons and short descriptions. Minimalistic infograph layout template with seven elements on a big thick line star

Vector green life circle cycle diagram / schema infograph with sample texts
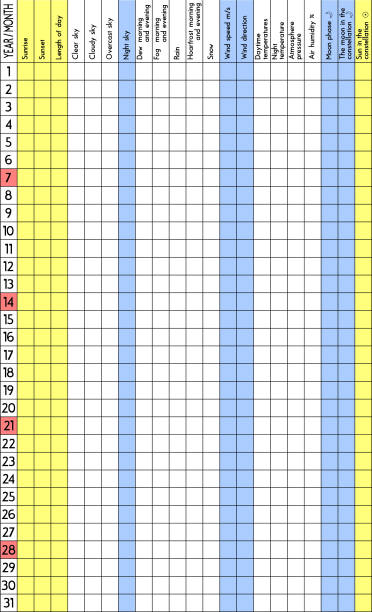
Vector Page weather observation vertical Legal format The font is drawn Layers good separated
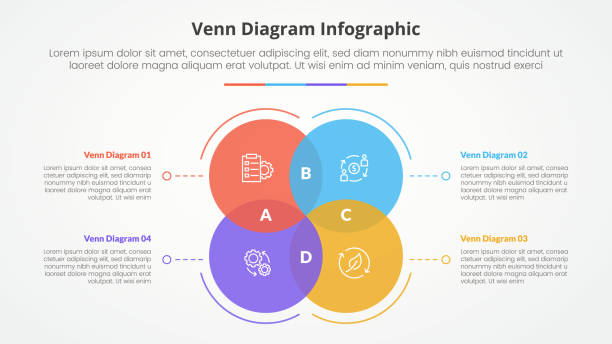
venn diagram infographic concept for slide presentation with big circle square structure shape with 4 point list with flat style vector
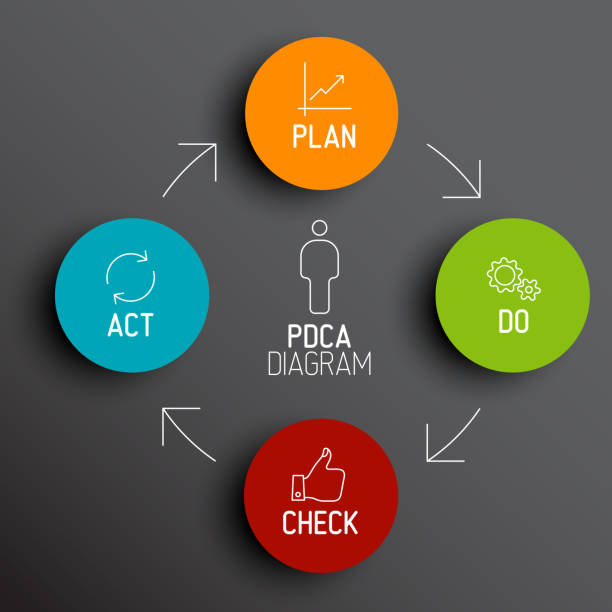
Vector dark PDCA (Plan Do Check Act) diagram / schema


The concept of rapid product development. The concept of the sprint product development. Diagram of life cycle of product development in flat style. Vector illustration Eps10 file
Vector Infographic stipe layers template with five levels - color pyramid template on dark gray background with icons, triangle pyramids and descriptions
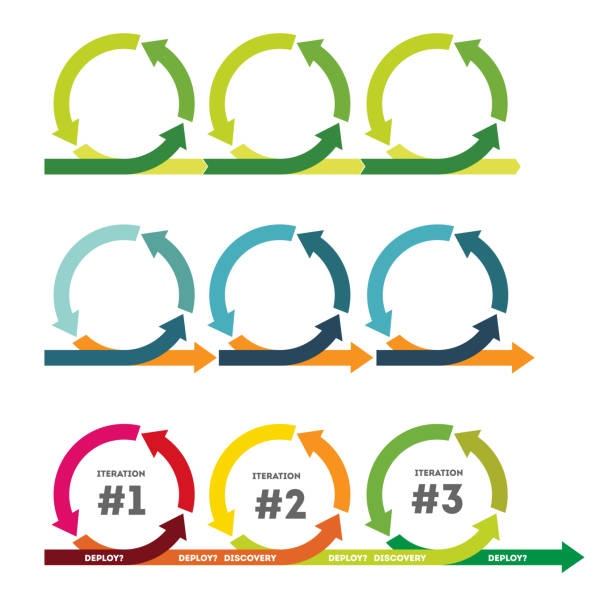
Iteration. The concept of life cycle of product development. Diagram of life cycle of product development in flat style. Vector illustration Eps10 file
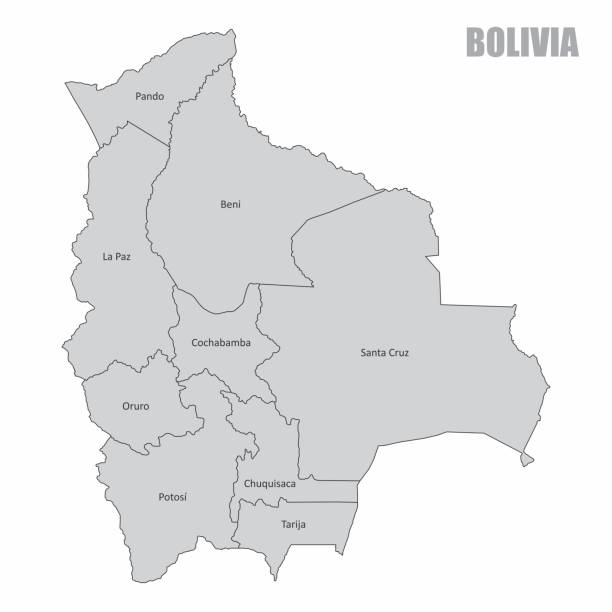
The gray map of Bolivia divided into regions

Mission. Vision. Values. Modern flat design concept. Vector icon on button white background. Vector illustration

Iteration. Development of a software product. The methodology of product development. Development process. Team development. Task planning. Flat style. Flat design

Simple Vector infographic for 6 ways how to avoid phishing emails template isolated on light background. Easy to use for your website or presentation.


Guyana dark silhouette map isolated on white background

PDCA circle (Plan, Do, Check, Action) - four steps management method for continuous improvement in business

Vector infographic template for food allergies.
Venn diagram icon with 3 overlapped circles. Template for business chart, marketing presentation, analytics schema, infographic layout. Set theory sign. Vecor outline illustration

Administration of database for software. Programmer workflow. Database scheme. Integrated Development Environment

Database Development Planning. Back-end project architecture development. Javascript

Vector Infographic circle layers template with five level volume share half circles - red color template with light background and percentage description items

Venn diagram. Circle infographic with intersections and overlap. Chart template with rounds. Mathematic schema for analysis. Vector

Simple visualization for company culture - mission, vision and values. Easy to use for your design or presentation.
Mission. Vision. Values. Modern flat design concept. Vector icon on white background. Vector illustration

Flow chart of a control panel of a web site. Relational database table


Process management with flowchart to improve productivity and successful efficiency of the company. Workflow robotic automation concept

Simple Vector infographic for 6 ways how to avoid phishing emails template isolated on dark background. Easy to use for your website or presentation.
Set of 40 Data Analysis web icons in line style. Graphs, Analysis, Big Data, growth, chart, research. Vector illustration

Information lifecycle management scheme. Methodology circle diagram with creation, storage, retrieval, usage and retirement. Blue on white background vector illustration.

Database structure. Flow chart of a control panel of a web site


Iteration. The concept of life cycle of product development. Diagram of life cycle of product development in flat style. Vector illustration Eps10 file

Vector business strategy concept template with chess figures - dark thin line version

Puzzles grid. Jigsaw puzzle 48 pieces, thinking game and 6x8 jigsaws detail frame

Vector SWOT diagram schema template made from four colorful squares
This vector icon set features triangular pyramid infographics, showcasing a collection of triangle hierarchy data segments. Each icon represents a different level or segment within a pyramid structure, effectively illustrating concepts related to business hierarchies, organizational structures, or data classification. The design is simple yet impactful, making it suitable for presentations, reports, or educational materials focused on conveying information in a visually engaging way. The pyramid shape emphasizes the relationship between different elements, helping viewers understand priorities or levels of importance within a given context. This set is a valuable resource for designers and professionals looking to enhance their visual communication.
Circle of arrow with 4 colors, 3D rendering

Vector Infographic circle layers template with five level volume share half circles - red color template with dark background and percentage description items


of27Next