00:14
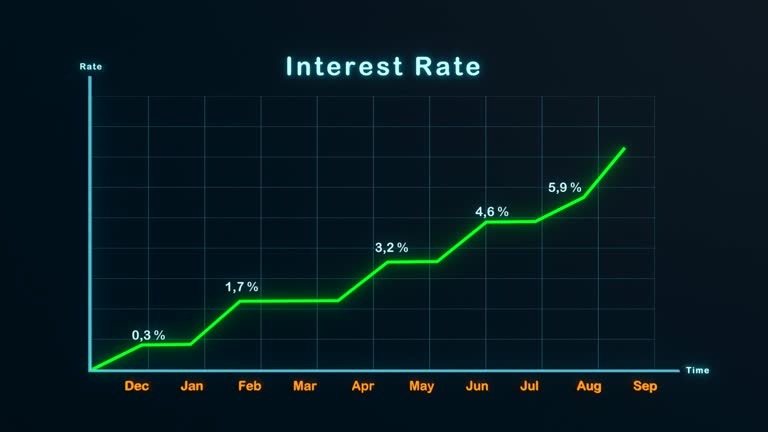
Chart with strong rise of interest rates on a screen. Sign of inflation, recession and economic deperession. 3D animation
Browse 6,400+ share market going upwards stock videos and clips available to use in your projects, or start a new search to explore more stock footage and b-roll video clips.
Chart with strong rise of interest rates on a screen. Sign of inflation, recession and economic deperession. 3D animation

Low angle View of Tall Corporate Buildings Skyscrapers and the Sky / Beijing, China

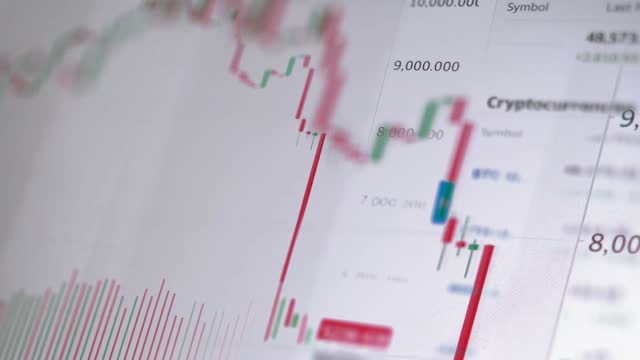
Charting success in the stock market! Witness the excitement on a black monitor as candlestick graphs create a captivating uptrend. Numbers come alive, revealing the positive momentum in this dynamic financial display. Stay tuned for the evolving market story!

4K Footage of Crowded Commuter business office people using escalator for traveling to work at Central of Sydney, Barangaroo, New South Wales, Australia, Business Travel and Transportation concept
Growing line graph of a digital income growth chart made in a technological style on a high-tech grid background. Concept for presentations, advertising and showing profitability and statistics

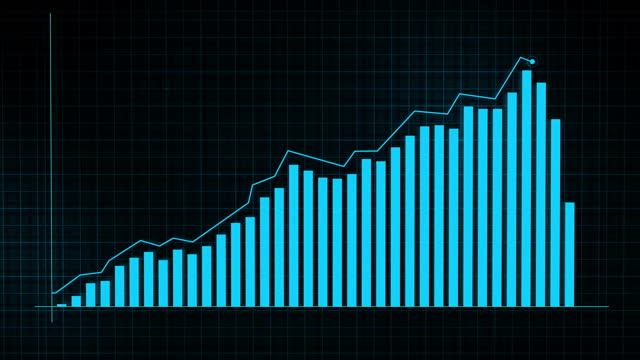
Rising graph, line, equity chart. Business, progress, growth, success, wealth, value, strategy, profit and return on investment. 3d animation

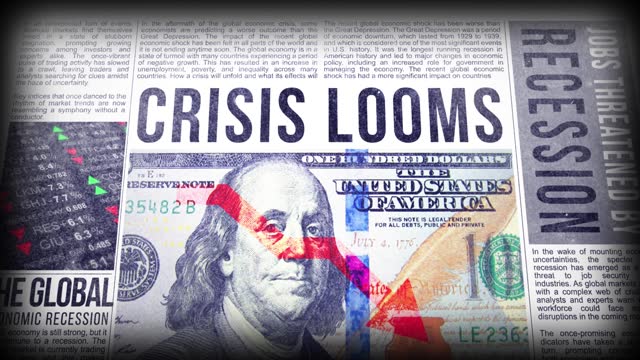
World currencies plummet down, financial crisis, stock market crash
Generic and representative stock market and exchange screens with speed animation and duplicate effect

Growing line graph of a digital income growth chart made in a technological style on a high-tech grid background. Concept for presentations, advertising and showing profitability and statistics, Businesswoman analyzing company's financial balance sheet working with digital augmented reality graphics. Businesswoman calculates financial data for long-term investment. Growing chart
3d Animation red arrow moving up icon. Luma Alpha matte. Business concept.
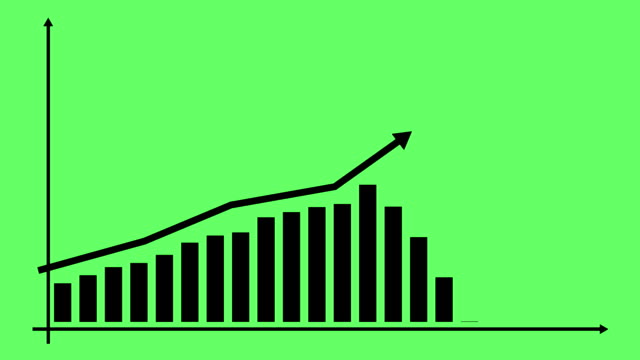
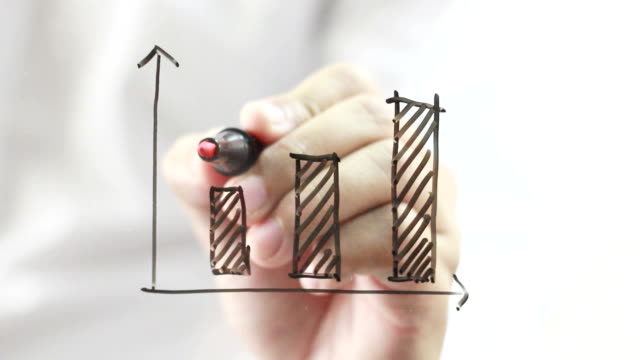
Financial growth chart with trend line graph. Growth bar chart of economy.

Commodity gas chart on a screen. Strong rise of the gas price. Sign of energy crisis, inflation and economic deperession. 3D animation

Pile up Golden coins and waveform line, expressed stock market, economic profits

Financial Green growth chart with trend line graph. Growth bar chart of economy. Vector illustration isolated on white background.

Pile up Golden coins and waveform line, expressed stock market, economic profits

3d rendered financial graphs, symbolizing success and positive market conditions. Seamlessly Loopable. Perfectly usable for topics like stock exchange, financial technology or business and economy in general.

Business and finance growth infographic rising bars in a graph chart animation

On hundred dollar bills there is a magnifying glass on which digital graphs of Chinese candles in red and blue colors move. Making Money. Cg.

Time lapse of stack of dollar growing against background of cryptocurrency chart. Paper money, cash currency and bitcoins. 100 US dollar bills. Investment success in the crypto world.

Growth graph on green screen background. Economic progress chart. Bars infographic. Statistics and data analysis.Profit concept.

Businesswoman analyzing company financial balance sheet working with digital virtual graphics Businessman calculating financial data for long term investment growth goals,

The word inflation on a screen surrounded by numbers, prices, currency, percentages, rising charts, graphs and lines. Animation

Close up blue candle stick chart. Stock market and exchange, investment, finanical data, trading information and business. 3D animation

Candlestick Chart Movement Cryptocurrency on Monitor Screen PC. Stock Exchange. A trader analyzes a graph of cryptocurrency on a notebook, drives cursor on a grid diagram. Online trading BTC, dollar.

Online exchange trading candles and up arrows financial growth Background. market prosperity transformation abstract business background. Big data business growth currency stock and investment economy

Female analyzing and looking at digital screen Candlestick Chart of stock market change and volatility prices diagrams on smart phone at home office. Dolly shot.

Animated blue bar graph showing successful business growth on blue background.

Rising prices cost of living interest rate tax raise crisis concept. Global CPI index data number surge up high in grocer market by cooking oil food supply chain issues at retail store grocery mall.

Rising chart, red moving average line, abstract reflections in the background. Stock market and exchange, analyzing, investment, risk, volatility, business.

Stock market price chart for analysis. Business analytic looking at computer. 4k resolution, macro shot. Depicts TradingView financial market chart.

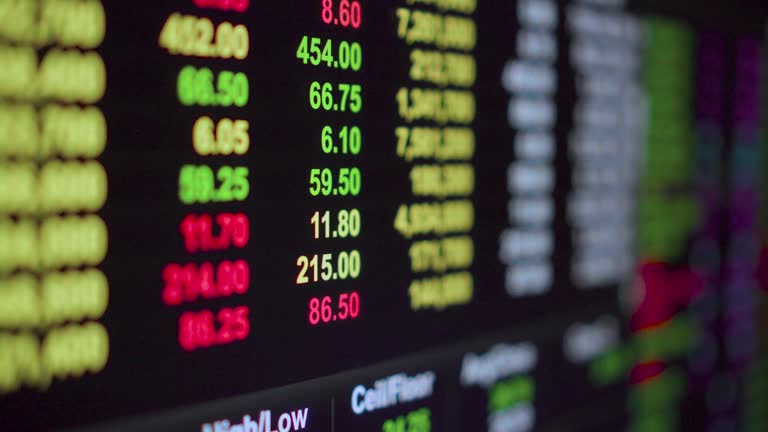
The video shows a stock market ticker with numbers scrolling up and down, representing the rise and fall of stock prices. Green arrows indicate increases, while red arrows indicate decreases.

3d rendered financial graphs, symbolizing success and positive market conditions. Seamlessly Loopable. Perfectly usable for topics like stock exchange, financial technology or business and economy in general.

Rising prices cost of living interest rate tax raise crisis concept. Global CPI index data number surge up high in grocer market by cooking oil food supply chain issues at retail store grocery mall.

Businesswoman working on keyboard. Laptop showing Growth up chart Success, rising business and financial graph, economy data diagram and money investment analysis,Animation of a business infographics with rising arrow.

Financial markets concept with charts, graphs, diagram and business data. Investment, stock market and exchange information, equity, commodity, prices. Concept, 3D animation.
CG Footage with graphs and diagrams on the background of icons with symbolic human connections with a flying map of the world.

Stock market Exchanges Volume Leaders Digital Tableau. Trader interface with company tickers with rising and falling prices. Business and finance 3d render. Cryptocurrencies market growth

Female analyzing Candlestick Chart of stock market change and volatility prices diagrams at digital screen touching on smart phone, sitting in living room at home.

Index on a screen. Looping.

Female analyzing and looking at digital screen Candlestick Chart of stock market change and volatility prices diagrams on smart phone at living room.

Trucking, Commercial Dock, Stock Market Data, Moving Up, Analyzing
Stock Market and Exchange, Finance, Stock Market Data, Economy, Stock Certificate, Dow Jones Industrial Average, Blackboard, Graph

3D Computer graphic animation of Stock chart moving up, economy and finance chart with positive emotion

Businesswoman analyzing.Business,Growth,Data,Manager,Improvement,Chart,Finance, Making Money,Business Strategy,Analyzing,Graph,Financial Advisor,Success,Marketing,Planning, Investment,

Growing chart on a background of communication equipment in the hosting data center. Popularity of the cloud services are rising and the sales of the telecommunication hardware are very profit.
Animated of Business arrow up growth in 4K background.

Fuel prices of diesel, gasoline energy commodities on stock exchange market concept. 4K UHD video animation loop.
2025 Businesswoman analyzing company financial balance sheet working with digital virtual graphics Businessman calculating financial data for long term investment growth goals

Currency exchange rate fluctuations. Japanese yen compared to American dollar

4K animation of infographic. Use for visualize financial graph, business chart, diagram, data, analyzing of something.

Graph, Chart, Business, Stock Market Data, Data
High Inflation rate. Economic Depression. Chart rises to increase in inflation rates. Diagram with percentage signs.
© 2025 iStockphoto LP. The iStock design is a trademark of iStockphoto LP. Browse millions of high-quality stock photos, illustrations, and videos.
Do Not Sell or Share