Circle Loading and Progress Bars Collection Set. Vector Illustration
Browse 17,600+ circle bar graph stock illustrations and vector graphics available royalty-free, or start a new search to explore more great stock images and vector art.
Circle Loading and Progress Bars Collection Set. Vector Illustration

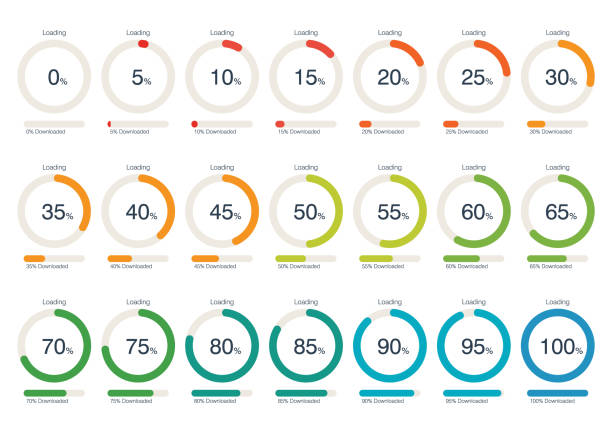
Circle progress bar set with percentage text from 0 to 100 percent. Turquoise blue, light grey. Infographic, web design, user interface. Flat design. Vector illustration, no transparency, no gradients
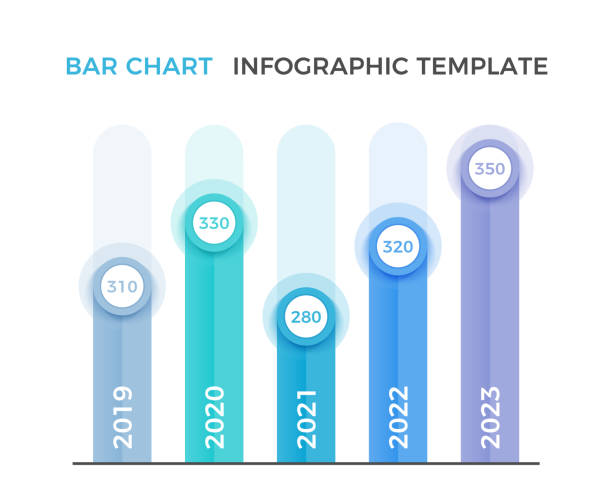
Colorful bar chart template with five elements, business infographics template, vector eps10 illustration
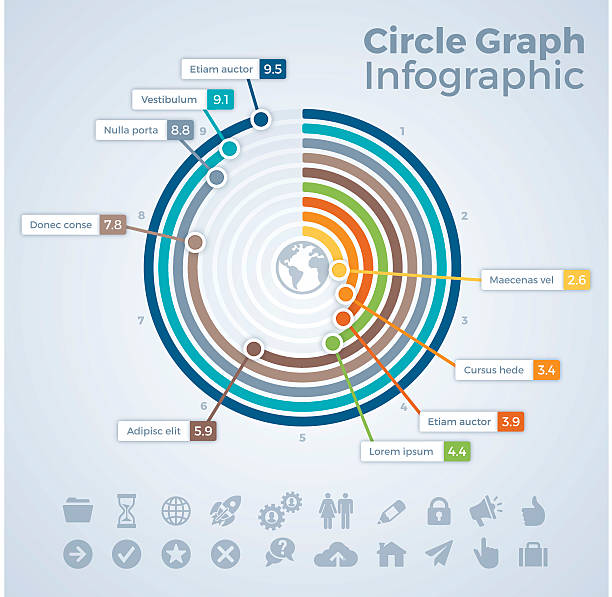
Circle bar graph data infographic concept with space for your copy. EPS 10 file. Transparency effects used on highlight elements.
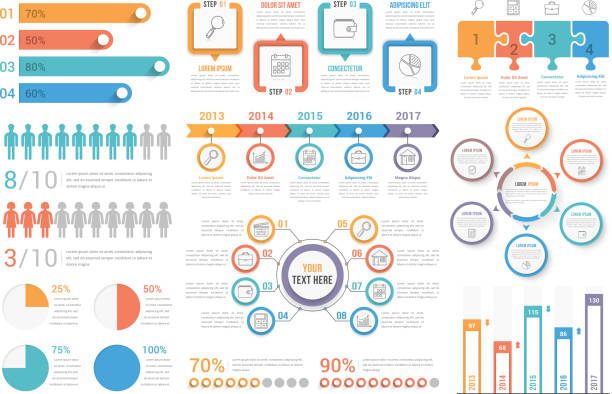
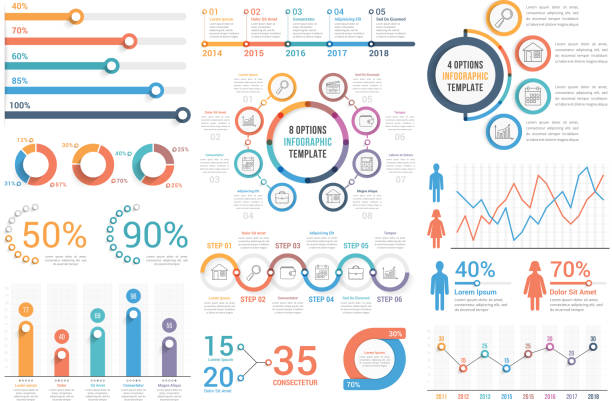
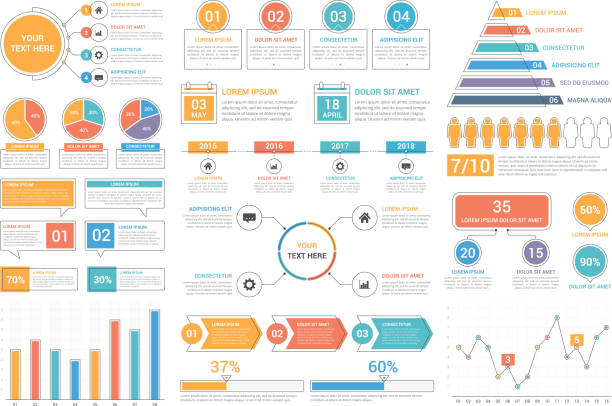
Set of most useful infographic elements - bar graphs, human infographics, pie charts, steps and options, workflow, puzzle, percents, circle diagram, timeline, vector eps10 illustration
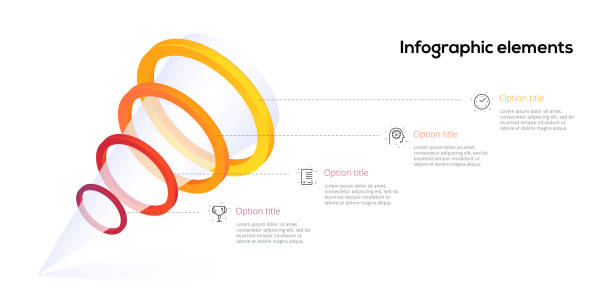
This is Infographic Elements. It can be used in almost every project.
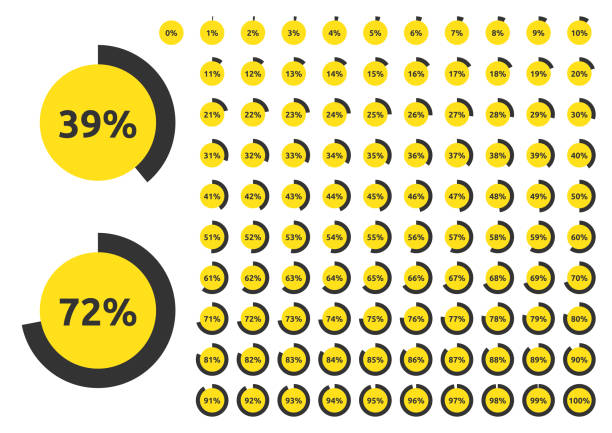
Circle progress bar set with percentage text from 0 to 100 percent. Yellow, black colors. Infographic, web design, user interface. Flat design. Vector illustration, no transparency, no gradients
Business blue analysis symbols for reports and presentations. Isometric graph, pyramid and pie chart set. Big data concept. Infographic 3D elements collection. Vector illustration isolated

Infographic elements - circle infographics, progress bars, timeline and pie charts, bar graph, people infographics, vector eps10 illustration

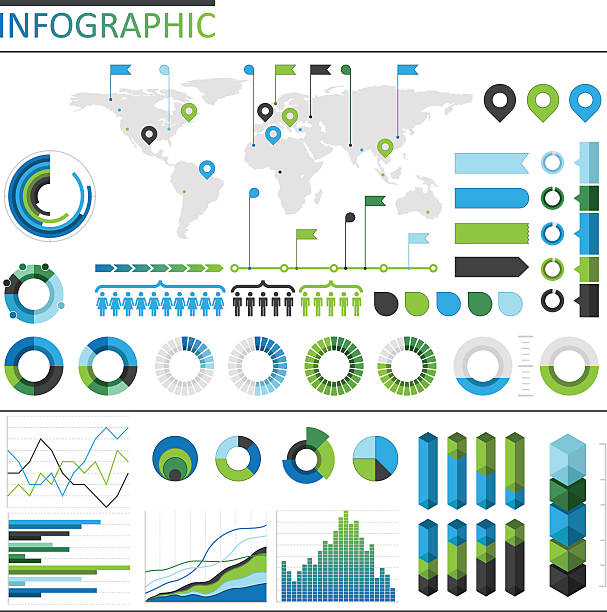
Map of World with a big set of infographic elements. This large selection of modern elements includes charts, pie charts, diagrams, demographic graph, people graph, datas, time lines, flowcharts, icons... (Colors used: red, green, turquoise blue, black). Vector Illustration (EPS10, well layered and grouped). Easy to edit, manipulate, resize or colorize. Please do not hesitate to contact me if you have any questions, or need to customise the illustration. http://www.istockphoto.com/portfolio/bgblue
Infographic elements - bar and line charts, percents, pie charts, steps, options, timeline, people infographics, vector eps10 illustration

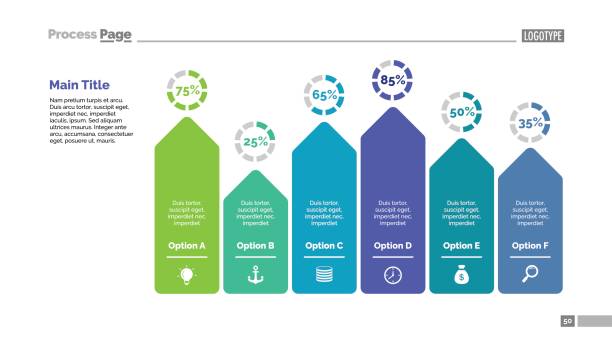
Six infographic templates for web, business, presentations - steps, options, funnel diagram, bar graph, vector eps10 illustration

Colorful music equalizer, audio visualizer

Bar graph and line graph templates, business infographics, vector eps10 illustration
Six arrows bar chart slide template. Business data. Percent, diagram. Creative concept for infographic, presentation, report. Can be used for topics like analysis, accounting, finance.
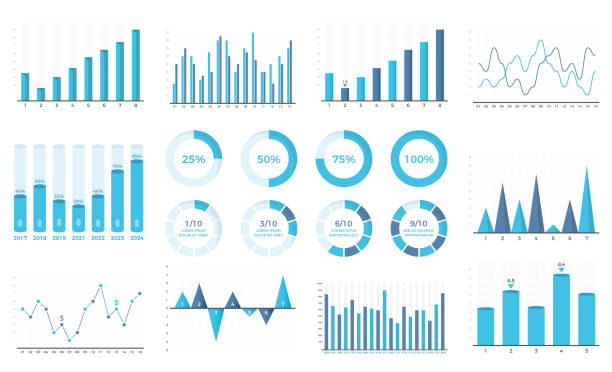
Set of bar graphs and line charts, circle progress indicators, vector eps10 illustration
Statistics - line icon set. Collection of 20 graphs, charts, diagrams...
HUD futuristic white element. Set of Circle Abstract Digital Technology UI Futuristic. Abstract circle geometric shape. Design element.

Graph chart. Financial statistic infographic template, stock and business histogram, financial modern analysis layout. Vector isolated set. Illustration of financial line analysis, finance histogram
Vector line icon set appropriate for web and print applications. Designed in 48 x 48 pixel square with 2px editable stroke. Pixel perfect.
Infographic elements - bar and line charts, percents, pie charts, steps, options, timeline, people infographics, vector eps10 illustration

Five item infographic symbols.

Textured colourful infographic elements set. Editable vectors on layers.

Bar graph and line graph templates, business infographics, vector eps10 illustration

Set of most useful infographic elements - bar graphs, human infographics, pie charts, steps and options, workflow, puzzle, percents, circle diagram, timeline, vector eps10 illustration
Infographic Elements Line Icons. Pixel perfect. Editable stroke. Vector illustration.
Info Graphic, chart, finance, technology, design element, progress report, analyzing,
Business charts graphs and infographic elements icons set isolated vector illustration

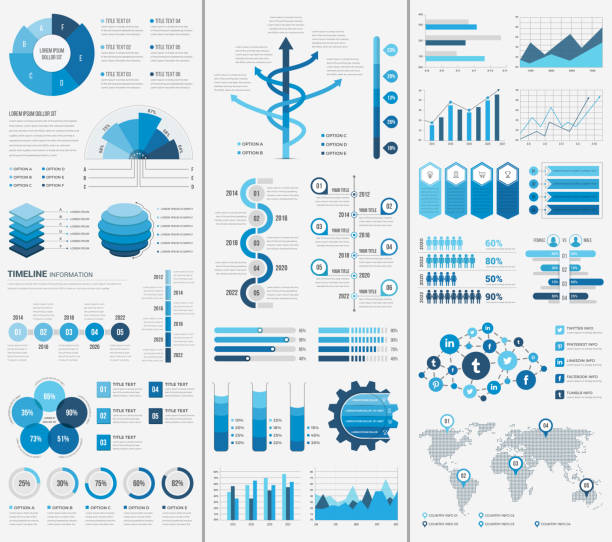
A set of modern infographic elements. EPS 10 file, with transparencies, layered & grouped,
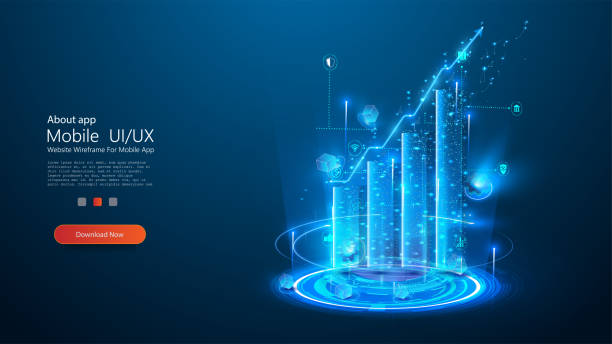
3d growth diagram in blue. The concept of business, finance, analytics. Digital vector monochrome graph on the background of a hologram or projection.

Business presentation page design set can be used for annual report, web design, workflow layout. Analysis concept. Process cart, flowchart, donut, pie graphs, organizational chart, bar graph
Update data loading progress icon.

Infographic dashboard template. Data screen with colorful graphs, charts and HUD elements, statistics and analytics. Intelligent technology interface with elements for dashboard and presentation

infographic, icon, business, step, timeline
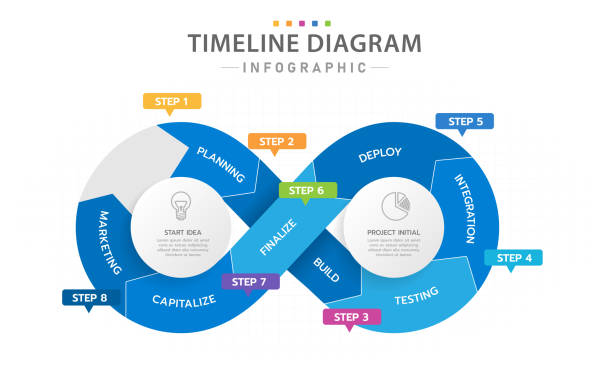
Infographic template for business. 8 Steps Modern Cycle Timeline diagram with project planning, presentation vector infographic.
Vector illustration of a blue magnifying glass in front of files icon in flat style.

Infographic elements - circle diagrams, timeline, bar graphs, pyramid chart, steps, options, vector eps10 illustration
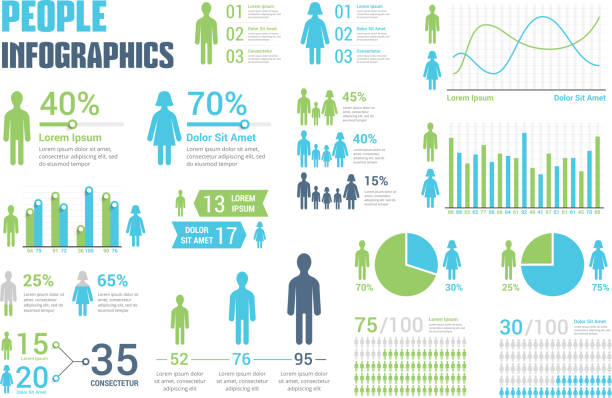
People infographics for reports and presentations - percents, bar and line graphs, pie charts, vector eps10 illustration

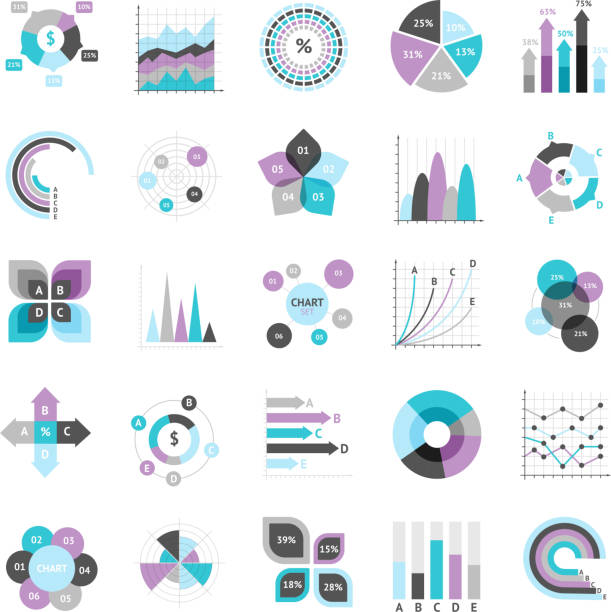
Set of the colorful charts, pie charts and other infographic design elements

Infographic charts and diagrams - set of modern vector isometric elements isolated on white background. High quality colorful images of different graphs. Business analytics, statistics concept
Isometric infographic elements with geometric shapes, icons, graphs, pie diagram, percentage. Set of Isometric 3D bar charts, statistics, report vector flat illustration isolated on white background.
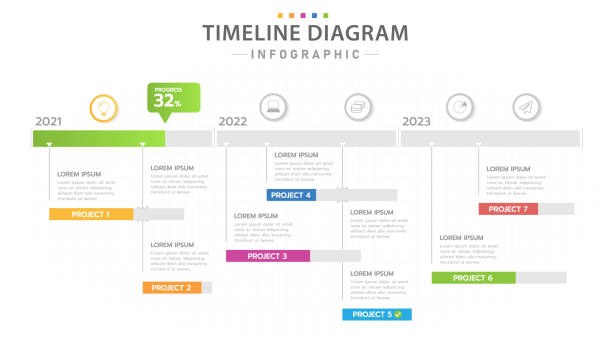
Infographic template for business. Modern Timeline diagram calendar with 3 years Gantt chart, presentation vector infographic.

Set of infographic templates - steps and options, pie charts, process, bar graph, flowchart, people infographics, vector eps10 illustration

Business Finance professional logo template vector icon