
Stock market investment data and analysis finance graph. Business financial chart with moving up arrow graph
Browse 382,500+ financial graphs and charts stock illustrations and vector graphics available royalty-free, or start a new search to explore more great stock images and vector art.

Stock market investment data and analysis finance graph. Business financial chart with moving up arrow graph
Simple vector line Icons. Editable stroke. Pixel perfect.

Abstract financial background with uptrend line, textured graphs, charts and copy space. Editable vectors on layers.

Abstract blue growing financial graph chart background. Vector dotted lines tech design
Growth - line vector icon set. 20 icons. Pixel perfect. Editable outline stroke. The set includes a Personal Growth, Revenue Growth, Rocket Launch, Percentage Growth, Presentation, Investment, Mountain Peak, Positive Emotion, Moving Up.

Simple Set of Increase and Decrease Related Vector Line Icons. Contains such Icons as Finance Chart, Abstract Graph, Trend and more. Editable Stroke. 48x48 Pixel Perfect.

Modern background design with abstract graphs and textures. Fully editable vector.

Digital analytics data visualization, financial schedule, monitor screen in perspective for presentations

Business financial chart with moving up arrow graph.Stock market investment data and analysis finance graph.

Business growth concept art collage. Halftone hands of colleagues holding rising arrow chart. Teamwork, work efficiency, partnership concept. Trendy modern retro vector illustration
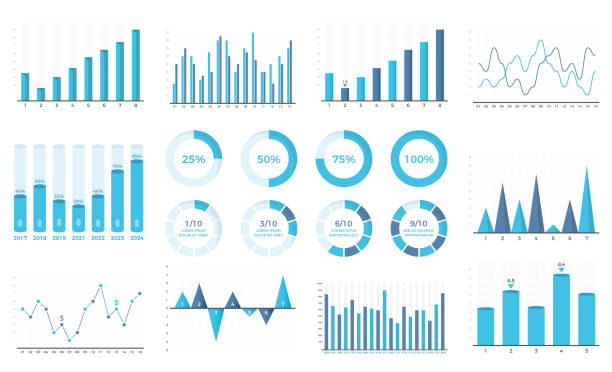
Set of bar graphs and line charts, circle progress indicators, vector eps10 illustration
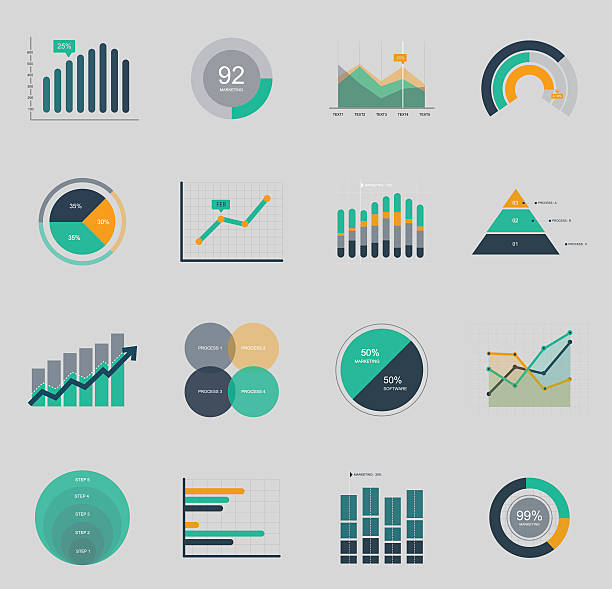
Business data market elements dot bar pie charts diagrams and graphs flat icons set isolated vector illustration.

Beautiful design and fully editable Analytics, analysis, statistics, searching icon for commercial, print media, web or any type of design projects.

Vector illustration of business reporting dashboard screen concept of data analysis and research presentation
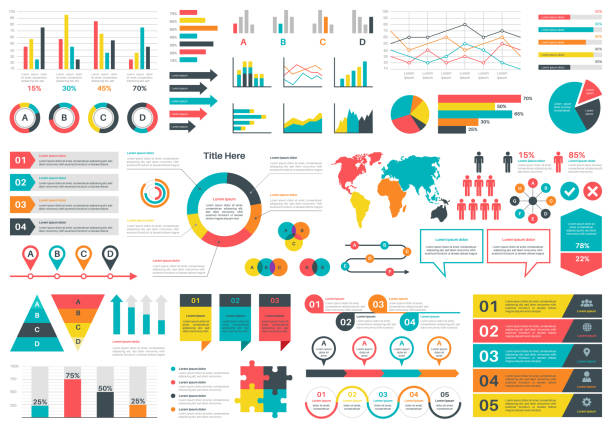
Infographics charts. Financial analysis data graphs and diagram, marketing statistic workflow modern business presentation elements vector investment progress icon set

Business growth graph chart and success financial arrow up. Development graph profit and investment

Business candle stick graph chart of stock market investment trading, Bullish point, Bearish point. trend of graph vector design. stock illustration
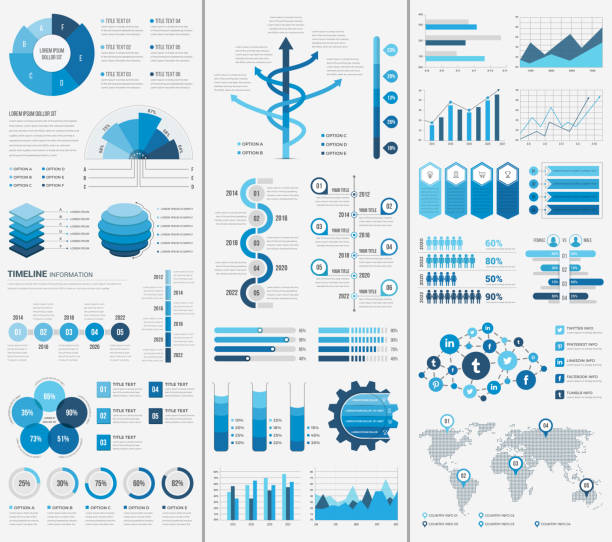
This is Infographic Elements. It can be used in almost every project.

Abstract business background with copy space. Textured striped financial graphs. Editable vectors.
Vector Icons - Adjust stroke weight - Expand to any size - Change to any colour
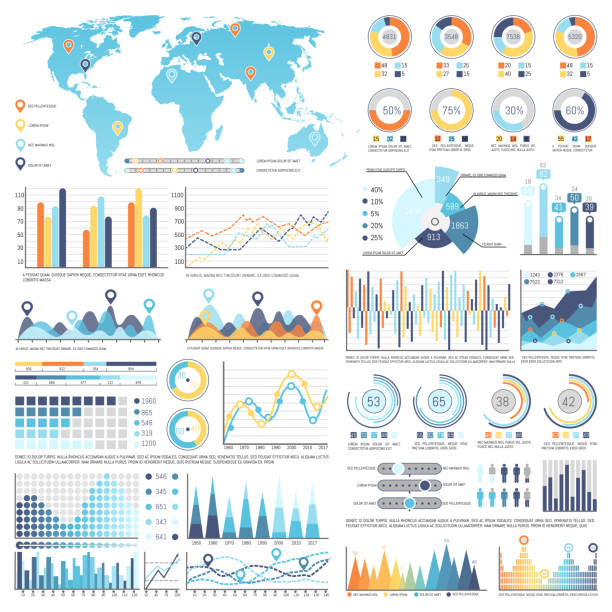
Collection of various types of infographics and charts along with blue template of world map isolated vector illustration on white background
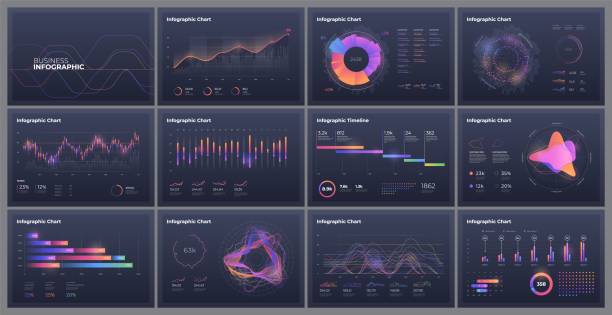
Dashboard infographic template with big data visualization. Pie charts, workflow, web design, UI elements.
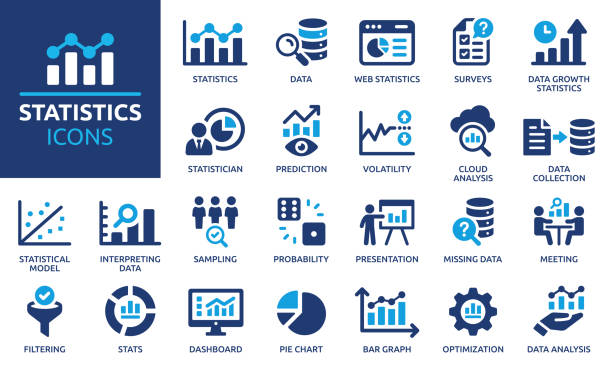
Containing data, web statistics, survey, prediction, presentation, cloud analysis and pie chart icons.

Well organized and fully editable Profit statistics icon, Earning growth chart icon for vector stock and many other purposes.
Vector Icons - Adjust stroke weight - Expand to any size - Change to any colour

Finance background illustration with abstract stock market information and charts over world map and stock indexes. stock illustration

Set of 3d office icon, Business and finance concept. Eps 10 Vector.

Stock market trading exchange chart.

Business Arrow Target Direction Concept to Success. Way to Success - Web Template. Applicable for Promotion , Cover Poster, Infographic, Landing Page, UI, UX, Persentation, Baner, Social Media Poster.

Set of 3d office icon, Business and finance concept. Eps 10 Vector.
Vector illustration in modern thin line style of progress icons: success, increase, evolution, and other. Pictograms and infographics for mobile apps.
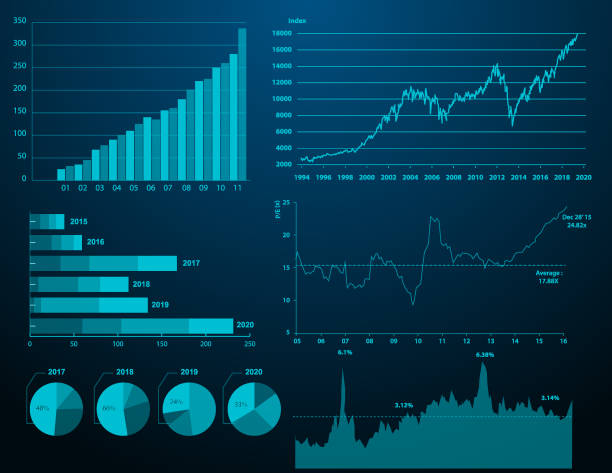
Vector of Financial graph with color background. EPS AI 10 file format

Vector illustration in flat style of a large monitor with tabs displaying graphs and chats and groups of people studying them. Isolated on background

Stock market investment trading graph in graphic concept suitable for financial investment or Economic trends business idea. Vector design.

Statistics data and analytics data analysis software laptop with bar graphs, pie charts and data information.

Income growth concept. Investment management. Successful Investments. Stock market vector illustration.
Efficiency - thin line vector icon set. 20 linear icon. Pixel perfect. Editable outline stroke. The set contains icons: Efficiency, Growth, Target, Test Results, Urgency, Stopwatch, Speedometer, Runner, Rocketship, Medal, Brainstorming.