Simple Set of Data Analysis Related Vector Line Icons. Contains such Icons as Big Data, Processing, Performance and more. Editable Stroke. 64x64 Pixel Perfect.
Illustrations
person analyzing datateam analyzing dataanalyzing data laptoppeople analyzing dataanalyzing data on screendoctor analyzing dataanalyzing data on computerman analyzing dataolder man analyzing datascientist analyzing dataanalyzing data healthcareanalyzing data stock marketbusiness people analyzing databusinessman analyzing dataanalyzing data computeranalyzing data iconmagnifying glass analyzing databusiness analyzing databusiness team analyzing datascience team analyzing datablack man analyzing databusiness person analyzing dataexecutive analyzing datacomputer analyzing datarobot analyzing datawoman analyzing data
Browse 375,200+ analyzing data stock illustrations and vector graphics available royalty-free, or search for person analyzing data or team analyzing data to find more great stock images and vector art.
Vector illustration in modern thin line style of technology related icons: optimization, robotic integration, business model, and more. Pictograms and infographics.
Research - vector set of linear icons. 20 icons. Pixel perfect. Editable outline stroke. The set includes a Data Analysis, Research, Artificial Intelligence, Scientific Experiment, Medical Exam, Medical Test, Microscope, Brainstorming, Market Research, Business Plan, Teamwork, Cloud Computing.

Simple Set of Search Related Vector Line Icons. Contains such Icons as Reverse Indexation, Search Bot, Artificial Intelligence and more. Editable Stroke. 48x48 Pixel Perfect.

Data analysis, research, audit, planning, statistics financial management vector concept Global swatches


Stock market candlestick financial growth chart.
Data inspection line icon. Diagram, magnifying glass, examination. Data science concept. Vector illustration can be used for topics like information technology, data protection, computer usage

Data Analytics Concept. Vector Illustration of Line Website Design. Banner Template.

Electronic document management vector illustration. Man with laptop flat style design. Documents flow and processing. Computer archive and information database. Data network flow concept
Data analysis line icons set. Research and big data analysis related symbol. Set of 25 big data growth, chart and analytics vector illustration.

Mobile telephone mobile device cell phone showing data and statistics dashboard held by a person in their hand.


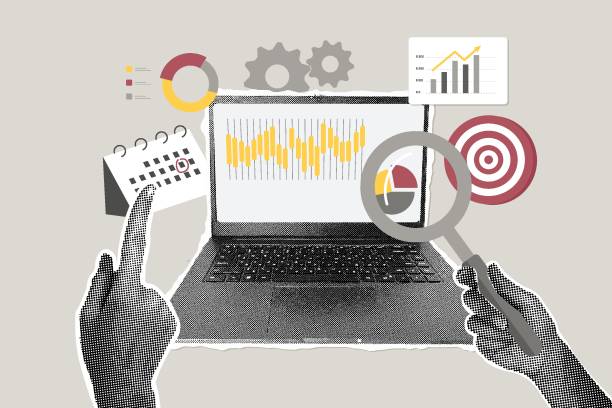
Fashionable halftone collage. Concept of analytics, business data, financial planning, investment,report. Trendy modern retro illustration. Vector illustration
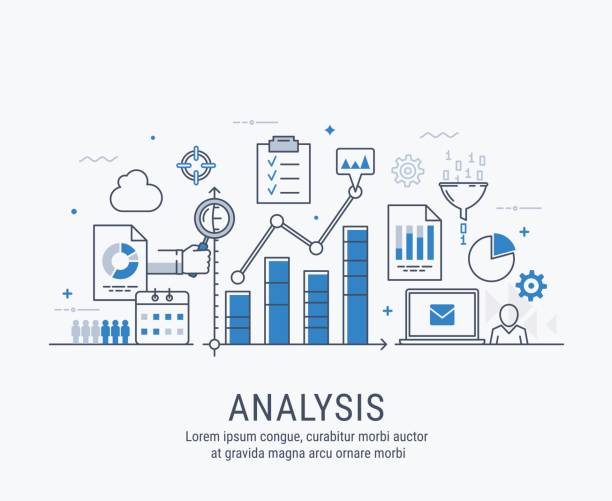
Modern thin line design for analysis website banner. Vector illustration concept for business analysis, market research, product testing, data analysis.

This file EPS 10 format. This illustration contains a transparency and gradient.

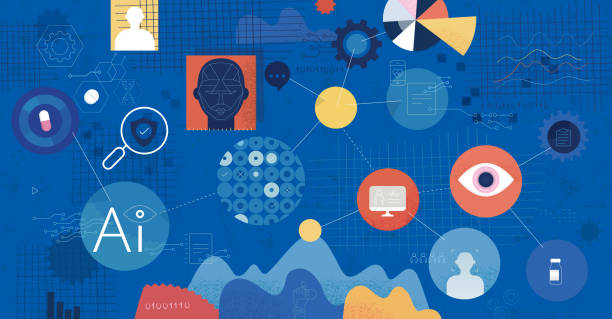
concept of big data or digital transformation technology

Abstract Big Data visualization digital network connection concept background. Artificial intelligence and engineering technology. Global network, Lines plexus, minimal array. Vector illustration

Business marketing strategy. Cartoon man and woman analyzing data, making presentation with charts about investments and product sales. Company management with employees working on laptops vector

Business people analysing data, using laptops and phones. Fully editable vectors.

Flat isometric design of data analysis and technology concept.

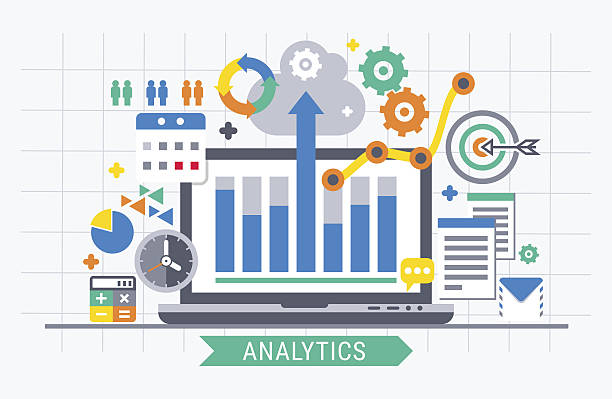
Flat design modern vector illustration concept of website analytics search information.

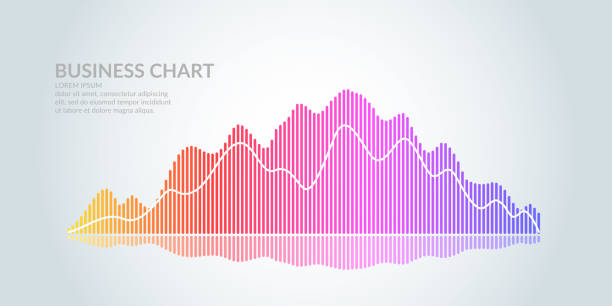
Abstract infographic visualization. Financial chart with uptrend line graphs and candlesticks. Futuristic network or business analytics. Graphic concept for your design.

VR HUD futuristic interface grid. Digital UI screen mesh pattern. GUI hi tech visor backdrop design template. Spaceship head up display red lines and particles on dark background. FUI Sci Fi dashboard
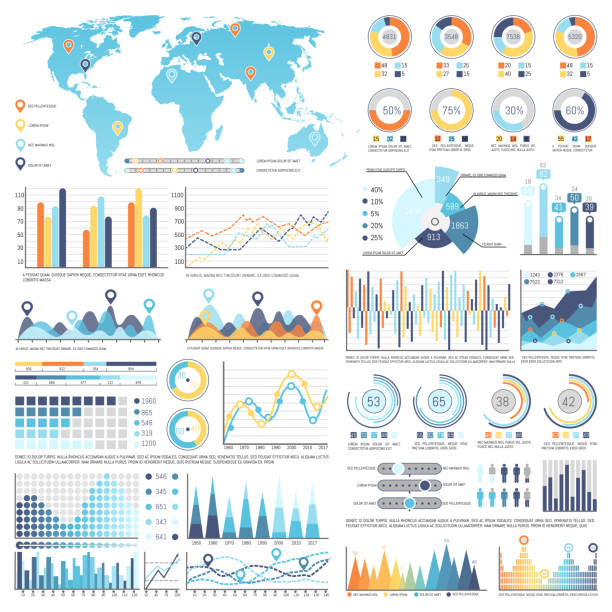
Collection of various types of infographics and charts along with blue template of world map isolated vector illustration on white background
Business graph on a white background. Chart analysts of growth and falling profits. Vector illustration.

Graph and Diagram, Charts, Traffic Analysis, Big Data, Editable Stroke Icon Set

Group of diverse colleagues using laptops and making notes while analyzing charts on board while working in office together

Abstract business chart with uptrend line graph, bar chart and diagram in bull market on dark blue background.
Trendy halftone collage. Fast business concept startup, innovation, business development, business people,creative marketing. Strategic planning. Illustration for web banner, social media banner. Vector illustration

Data Analytics Digital Marketing Market Research Tool concept illustration
Vector illustration with hand drawn textures depicting artificial intelligence in medical sciences - abstract concept. The use of machine learning models to search medical data and uncover insights to help improve health outcomes and patient experiences.
Vector set of flat business chart icons
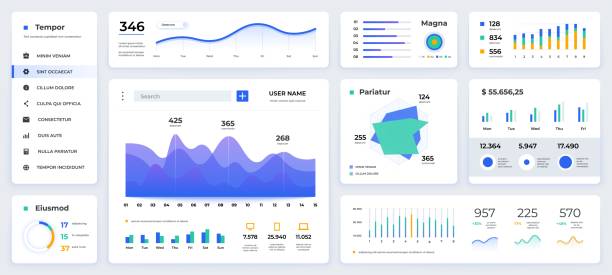
Dashboard UI. Modern presentation with data graphs and HUD diagrams, clean and simple app interface. Vector abstract modern web UI design

Key Performance Indicator concept with a businesswoman, gauge, and target symbolizing growth and goals. Neubrutalism style
Creative vector illustration of HUD interface elements set, infographics Sci Fi isolated on transparent futuristic background. Mega Art Collection design template. Abstract future concept science virtual graphic, HUD Hologram Futuristic Elements icons Set Vector on black background.
A set of data scientist icons that include editable strokes or outlines using the EPS vector file. The icons include data scientists sitting at table on laptops, hand with magnifying glass extracting data, statistician with magnifying glass searching for data, data being funneled, a data analyst at computer with different graphs and charts, online pie chart and line graph representing big data, computer programmer at monitors with code, data scientist holding pie chart, calculator and paper with line graph, programming code on laptop, data scientist graduate holding diploma, data being analyzed on smartphone, data analyst presenting data, data scientist holding lightbulb and other related icons.

Abstract blue growing financial graph chart background. Vector dotted lines tech design

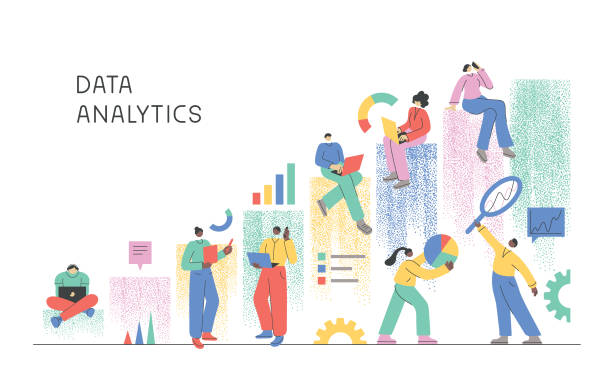
Data analysis concept with characters. Can use for web banner, infographics, hero images. Flat isometric vector illustration isolated on white background.


Isometric web banner Data Analisis and Statistics concept. Vector illustration business analytics, Data visualization. Technology, Internet and network concept. Data and investments
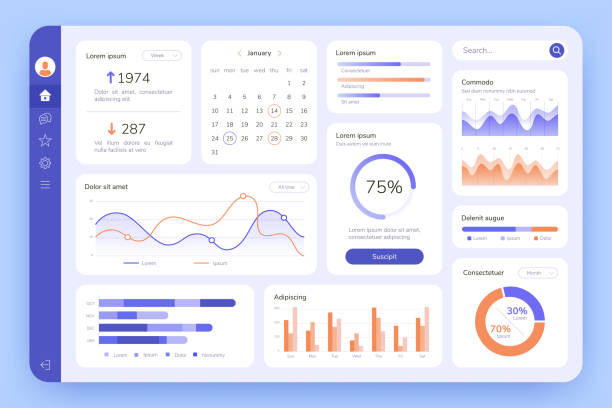
Dashboard. UI infographic, data graphic and chart. Screen with business analytics. Admin statistical software, web interface vector template. Illustration statistical infographic data screen

Office workers analyzing and researching business data vector illustration. Marketing analysts developing strategy. Business people studying infographics and diagrams on dashboard
Banner with focused magnifying glass on gear and multicolored pie chart with name Data analysis on blue background. For web construction, mobile applications, banners, corporate brochures, layouts

Vector graphics infographics with six options. Template for creating mobile applications, workflow layout, diagram, banner, web design, business reports with 6 steps. Stock vector

Financial audit. Budget graph, tax expert and business finance balance valuation. Managment calculation, financial accounting or audit tax service. Isometric 3D vector illustration icons set
20 Outline Style - Black line - Pixel Perfect icons / Set #46 Icons are designed in 48x48pх square, outline stroke 2px. First row of outline icons contains: Organization Chart, Financial Report, Cloud Computing, Bar Graph, Brainstorming; Second row contains: Moving Down Chart, Bar Graph Chart, Dashboard Chart, Analyzing Chart, Moving Up Chart; Third row contains: Mobile Phone and Graph, Laptop Chart, Separating Funnel, Clipboard and Pie Chart, Network Server; Fourth row contains: Calculator, Gears icon, Magnifying glass and Chart, Flask and Check mark, Conference. Complete Primico collection - https://www.istockphoto.com/collaboration/boards/NQPVdXl6m0W6Zy5mWYkSyw
Editable Stroke - Inspection - Line Icons