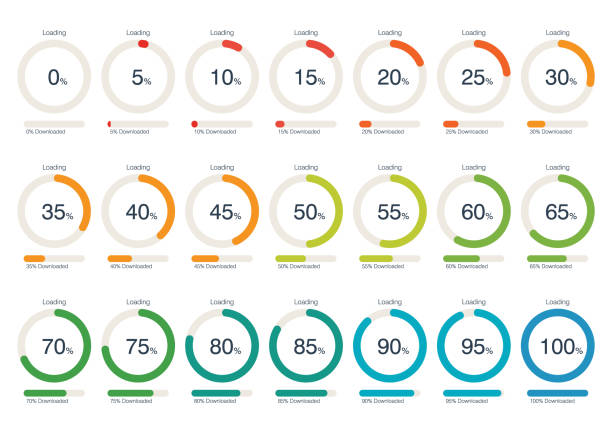
Circle Loading and Progress Bars Collection Set. Vector Illustration
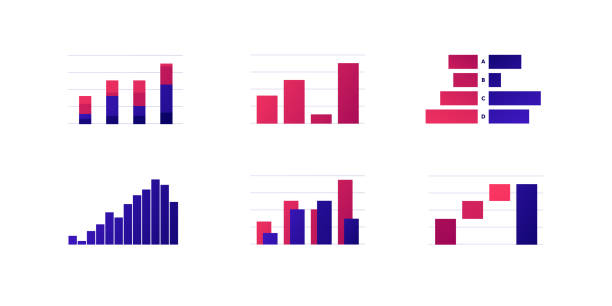
Browse 3,000+ stacked bar chart stock illustrations and vector graphics available royalty-free, or search for stacked bar chart icon to find more great stock images and vector art.
Circle Loading and Progress Bars Collection Set. Vector Illustration
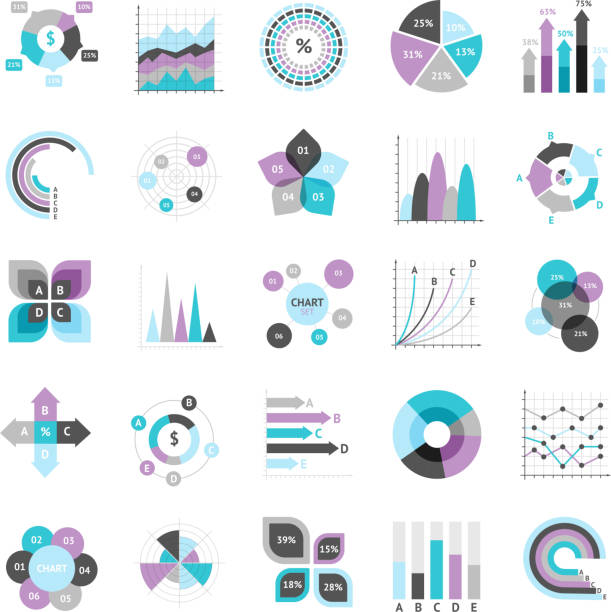
Graph icon set. Illustrator 10 vector image.

Graph And Diagram Colored glyph icons flat - Vector

Infographic elements for business layout, presentation template and finance report. Data visualization with Stacked Bar Chart.
Abstract square pixel 3d background border concept.

Collection of premade vector infographic elements widely used in data visualization, presentation, custom infographics, business reports, marketing, websites and more

Business infographic elements set with dot bar pie line charts vector illustration

A lot of money organised to form a bar chart.
Set of infographic outline vector icons.

Colorful Infographic Diagram, Bar Chart or Report Template with Icons - Illustration in Freely Editable Vector Format

Pyramid chart for infographics design or web template
Increasing stack of isometric money with arrow, making profit, revenue growth infographic vector
Chart Types related single line icons pack.

Three stacks of coins, each increasing in height from left to right on a horizontal line. Ideal for finance, savings, investment, economy, growth.

The woman interacting with the statistical analysis and diagram. Data analysis in isometric vector design. Network mainframe infrastructure website layout.
Stacked Bar icon vector image. Can be used for Infographic.
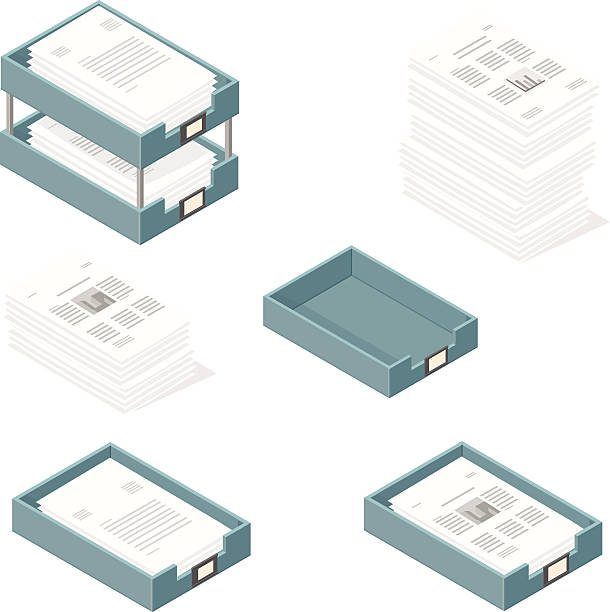
A vector illustration icon set of in and out trays for business - with paper documents and financial graphs.

Illustration and Painting

Money, financial and mobile banking line drawing concepts.
Business charts graphs and infographic elements icons set isolated vector illustration
Graph, diagram and chart - simple outline icon set. Editable strokes and Layered (each icon is on its own layer with proper name) to enhance your design workflow.

This is a set of commercial illustrations, easy to modify, infinitely magnified
Info Graphic, chart, finance, technology, design element, progress report, analyzing,
20 Outline Style - Black line - Pixel Perfect icons / Set #39 / Infographics / Icons are designed in 48x48pх square, outline stroke 2px. First row of outline icons contains: Projection Screen with growing arrow, Flow Chart, Planning Chart, Organization Chart, 3D Pie Chart; Second row contains: Moving Down Chart, Diagram, Pyramid Chart, Alphabetical Order, Moving Up Chart; Third row contains: Triangle Report Chart, Data line Chart, Circle Report Chart, Line Graph Chart, Financial Report Chart; Fourth row contains: Bar Graph Chart, Multi - Layered Effect, Spreadsheet, Pie Chart, Dashboard Chart. Complete Primico collection - https://www.istockphoto.com/collaboration/boards/NQPVdXl6m0W6Zy5mWYkSyw

These illustrated piles of American Dollar Bills are simple and minimalistic design elements, ideal for your financial design project. The size of the stacks increases to signify profit or positive revenue growth. The illustrator 10 vector file can be coloured and customised to suit your needs and scaled infinitely without any loss of quality.

Progress bar of love, relationship meter. Valentine day concept. Scale of partnership satisfaction. Passion measuring indicator. Heart symbol. Love UI element for web isolated flat vector illustration
Chart Types & Data Visualization related vector icons.
Infographic - 25 Outline Style - Single black line icons - Pixel Perfect / Pack #31 / Icons are designed in 48x48pх square, outline stroke 2px. First row of outline icons contains: Projection Screen with growing arrow, Flow Chart, Planning Chart, Organization Chart, 3D Pie Chart; Second row contains: Moving Down Chart, Diagram, Pyramid Chart, Alphabetical Order, Moving Up Chart; Third row contains: Triangle Report Chart, Data line Chart, Circle Report Chart, Line Graph Chart, Financial Report Chart; Fourth row contains: Moving Up Graph, Equalizer, Growing Arrows, Pie Chart, Moving Down Graph; Fifth row contains: Multi - Layered Effect, Bar Graph Chart, Spreadsheet, Dashboard Chart, Jigsaw Puzzle. Complete Grandico collection - https://www.istockphoto.com/collaboration/boards/FwH1Zhu0rEuOegMW0JMa_w

Fallen bar charts and small houses
Business Infographic icon vector

Colorful Infographic Diagram, Bar Chart or Report Template with Icons - Illustration in Freely Editable Vector Format
Info Graphic, chart, financial report, report

Abstract and symbolic presentation. Business growth. Business man on a bar graph made of coin, thinking. Outline vector illustration.
Low, Moderate and High gauges colorful illustraion