Images
Graph Up Down Pictures, Images and Stock Photos
Browse 60,600+ graph up down stock photos and images available, or search for question mark to find more great stock photos and pictures.
Most popular
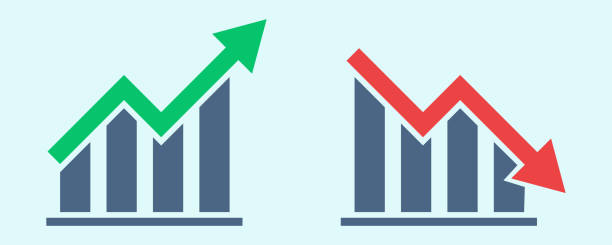
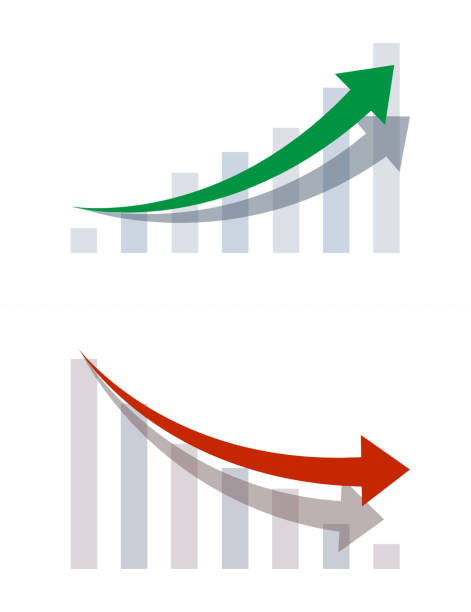
Financial arrows up and down. Vector graph with green and red arrows. Chart with increase, decrease. Vector 10 EPS.

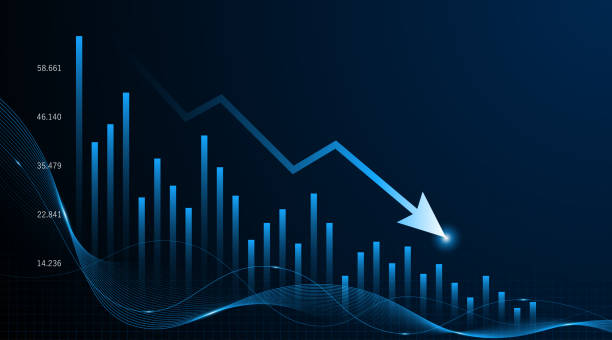
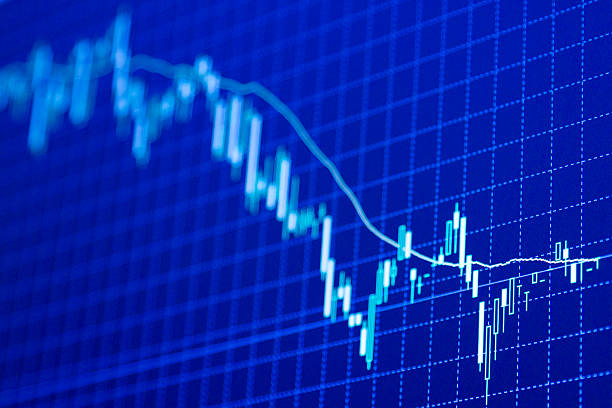
Down arrows over blue financial graph background. Horizontal composition with selective focus and copy space. Investment, stock market data and finance concept.
Our creative library is free of AI-generated contentChoose your visuals with confidence knowing our creative library is free from AI-generated content, so your searches only return safe, high-quality visuals you can trust.
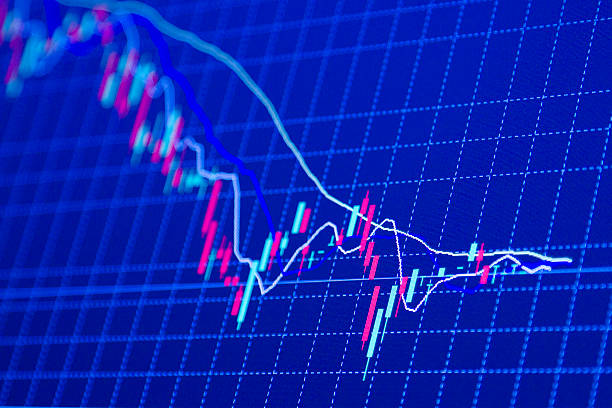
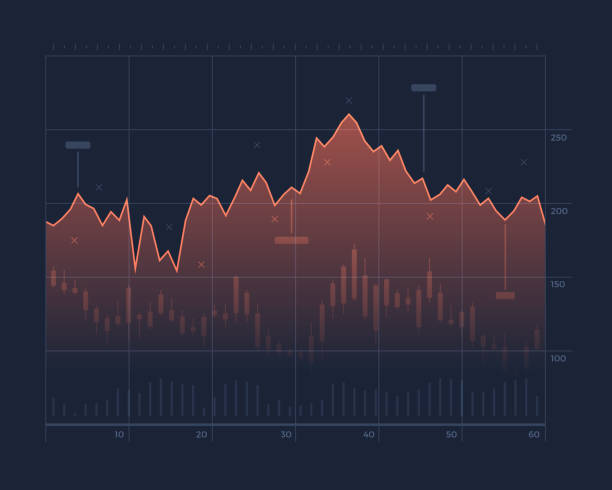
forex candlestick charts monitored
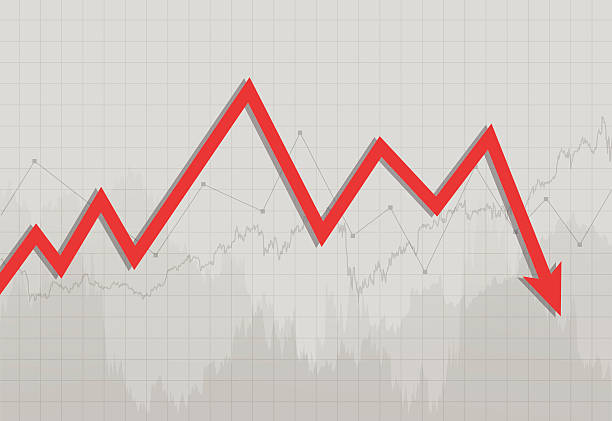
Illustration contains a transparency blends/gradients. Additional .aiCS6 file included. EPS 10

Simple Set of Increase and Decrease Related Vector Line Icons. Contains such Icons as Finance Chart, Abstract Graph, Trend and more. Editable Stroke. 48x48 Pixel Perfect.
Financial asset cryptocurrency growth stocks mutual fund value decreasing losing value dropping red abstract background pattern.
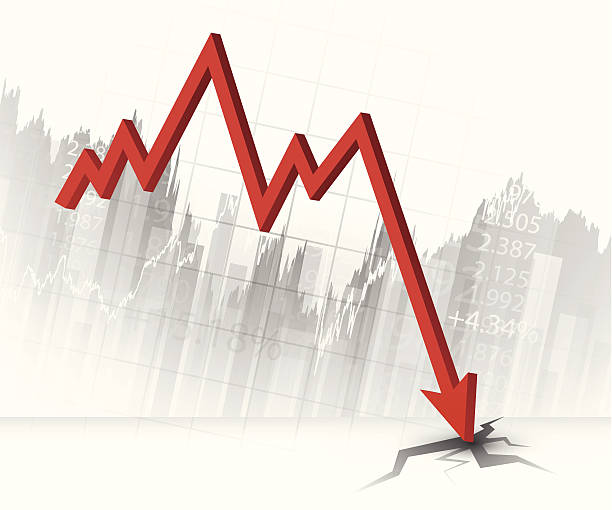
Illustration contains a transparency blends/gradients. Additional .aiCS5 file included. EPS 10
Downward trend of business graph or investment concept with decreasing profits. company downward arrow

chart with red and green arrows on LCD screen, green one is pointing upwards, the red one is declining.

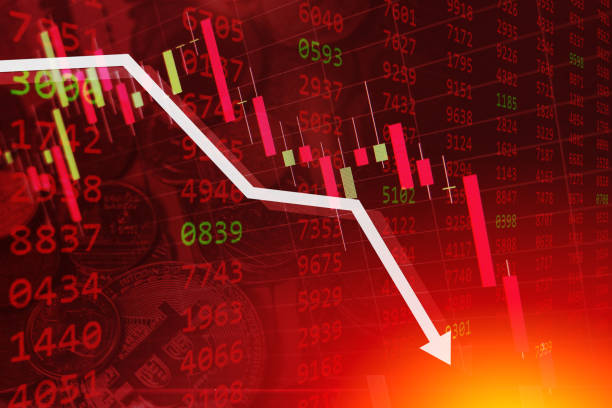
Economic crisis - Stock market graphs and charts - Financial and business background

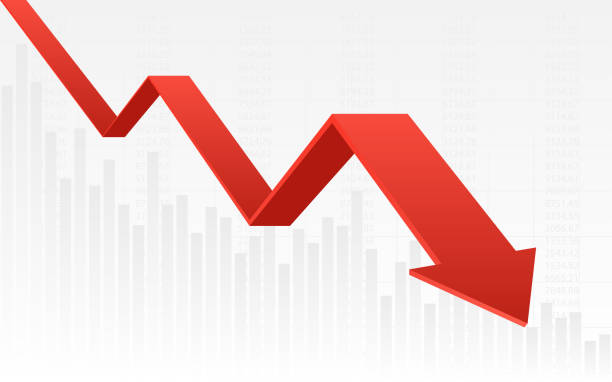
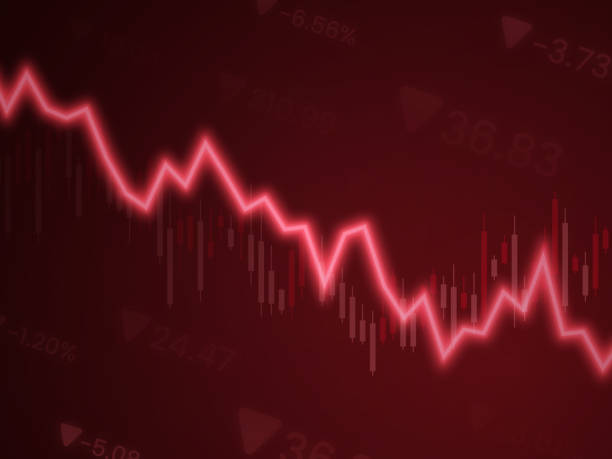
Stock market chart. Financial falling line graph. Red descending arrow. Stock market correction, falling or drawdown. Business falling, losses. Financial crisis chart. Vector illustration.


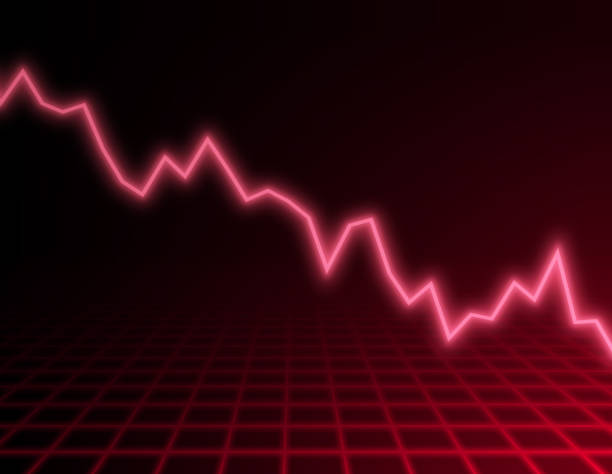
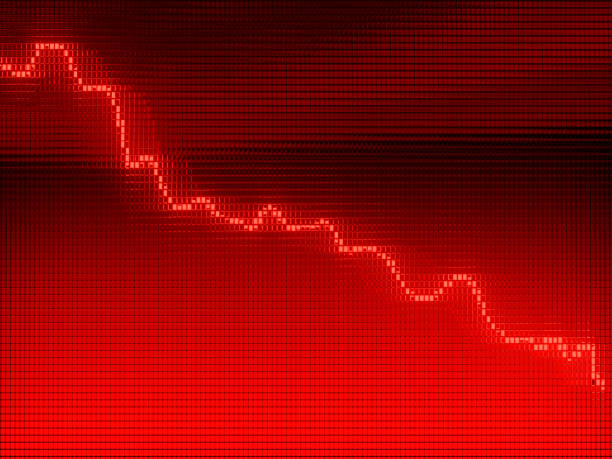
Stock market decrease decline depression recession red 3d grid graph.
16 Increase and Decrease Line Icons. Arrow, Benefits, Charity Benefit, Chart, Contrasts, Crash, Currency, Development, Diagram, Direction, Downloading, Falling, Finance, Finance and Economy, Financial Report, Graph, Growth, High Up, Interest Rate, Investment, Lowering, Making Money, Mathematics, Moving Down, Moving Up, Negative Emotion, Performance, Planning, Pointing, Positive Emotion, Presentation, Price, Reduction, Sharing, Stock Market and Exchange, Stock Market Data, Success, Traffic Arrow Sign.
Red arrow down icon. Indication decline arrow sign. Financial decrease statistic graphic symbol. Financial losses chart. Vector illustration

3d rendering of Arrows with sunlight, Directions, Goals, Target,Focus, Choice. Glass Material, Transparent Arrows.
Vector : Decreasing graph and arrow on red stock board
Simple collection of reduction related line icons. Thin line vector set of signs for infographic, logo, app development and website design. Premium symbols isolated on a white background.

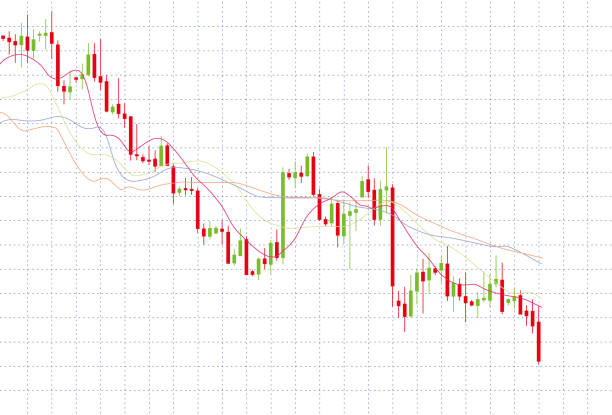
Forex trading candlestick chart. Bearish pattern. Suitable also for stock exchange and crypto price analysis.
Stock market trading exchange chart.


Coin stacks and chart graphs on a chessboard background. Horizontal composition with selective focus and copy space.
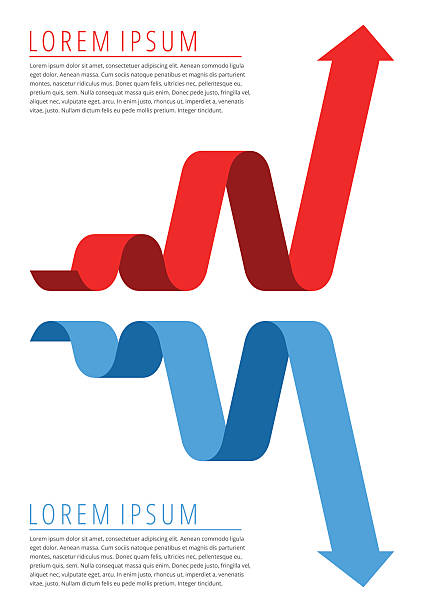
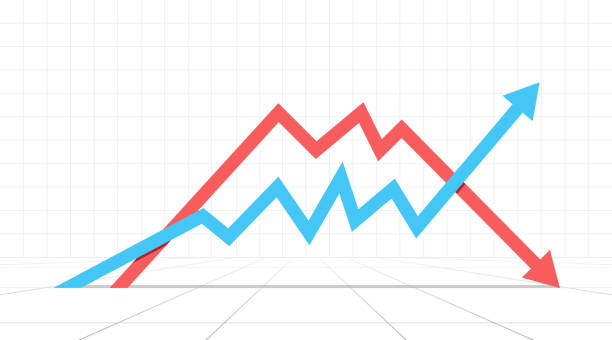
Increasing graph and decreasing graph concept. Red progress arrow and blue recession arrow isolated on white background represent increase profit and recession business.
Stock market commodity financial valuation ticker chart average stock price information abstract background.
Red arrow pointing down with declining bar graph on red background downward trend in investment recession financial crisis inflation. 3d render illustration

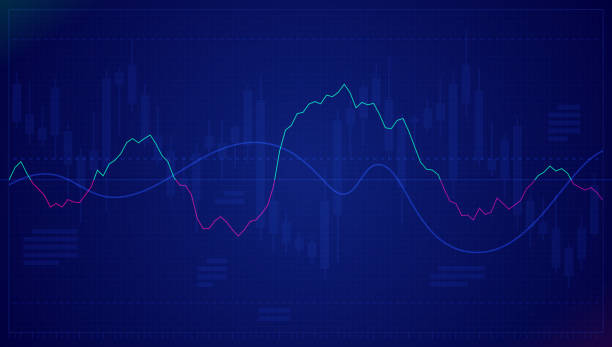
Blue financial market chart candles vector background for representing falling stock prices. For use as background template for business documents, blogs, banners, advertising, brochures, posters, digital presentations, slideshows, PowerPoint, websites
20 Outline Style - Black line - Pixel Perfect icons / Set #39 / Infographics / Icons are designed in 48x48pх square, outline stroke 2px. First row of outline icons contains: Projection Screen with growing arrow, Flow Chart, Planning Chart, Organization Chart, 3D Pie Chart; Second row contains: Moving Down Chart, Diagram, Pyramid Chart, Alphabetical Order, Moving Up Chart; Third row contains: Triangle Report Chart, Data line Chart, Circle Report Chart, Line Graph Chart, Financial Report Chart; Fourth row contains: Bar Graph Chart, Multi - Layered Effect, Spreadsheet, Pie Chart, Dashboard Chart. Complete Primico collection - https://www.istockphoto.com/collaboration/boards/NQPVdXl6m0W6Zy5mWYkSyw
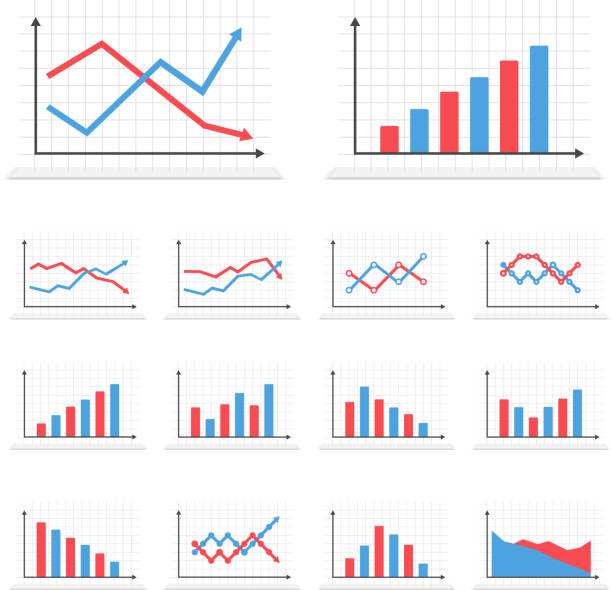
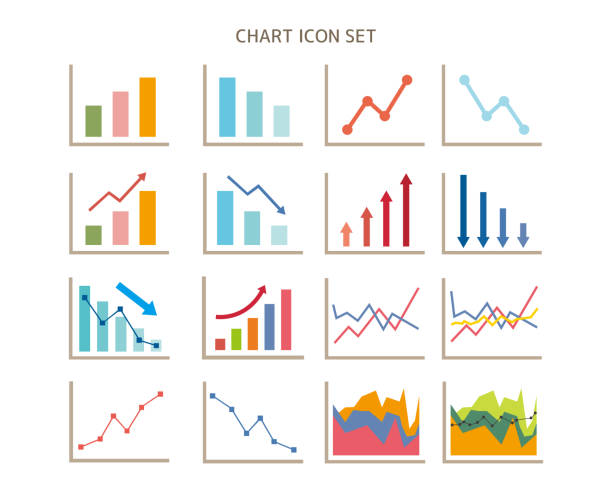
Set of different graphs on white background, vector eps10 illustration
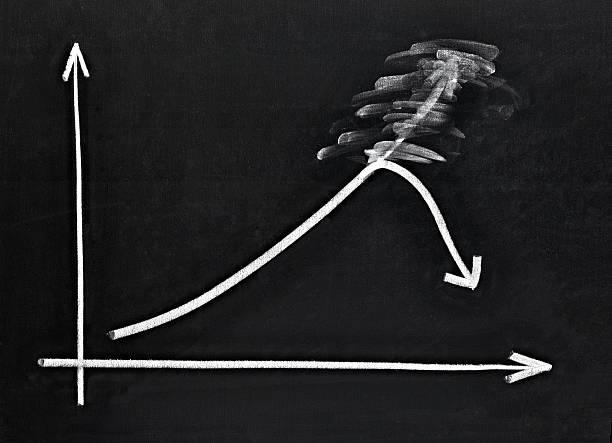
close up of chalkboard with finance business graph
forex candlestick charts monitored
Stock exchange concept show about profit and loss trading of trader. Vector illustration.


close up shot of a digital stock market tracking graph follwing a recent crash in prices. Bear market 3D illustration
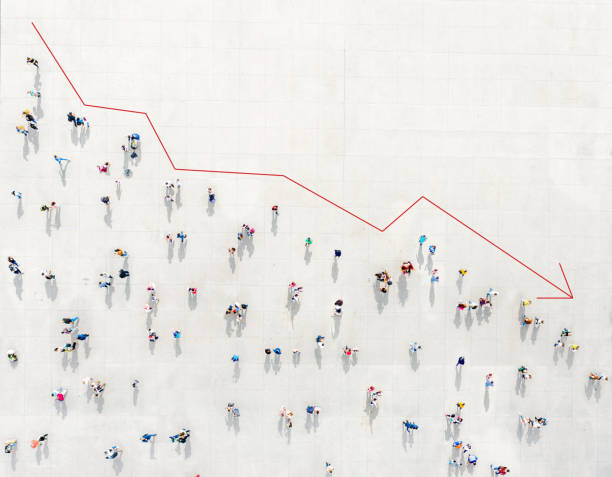
Crowd from above forming a falling chart showing unemployment
Downwards glowing red arrow on grey statistic grid background. Business and finance. Profit and loss. Counting money.
Stock market information graph


Closeup of a stock market broker working with graphs on digital tablet at office. Rear view of stock agent reading bad report and graph. Back view of multiethnic businessman analyzing fall sales.

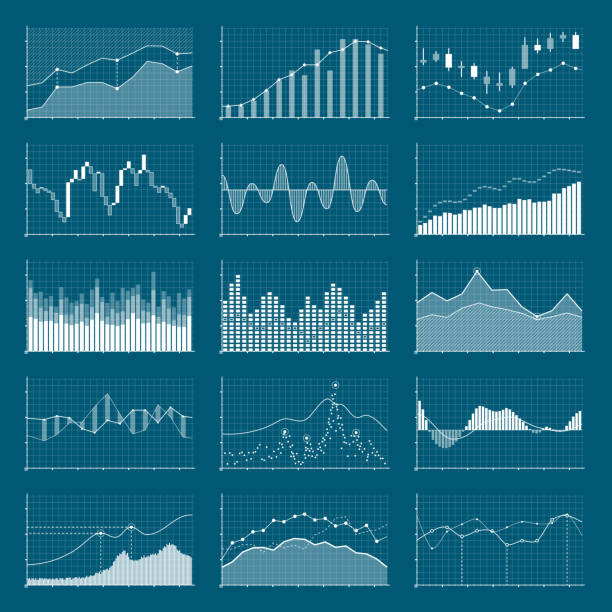
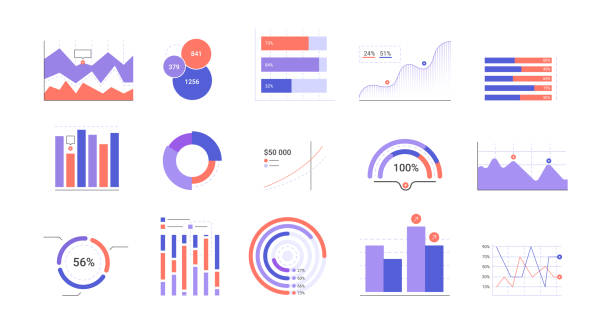
Business data financial charts. Stock analysis graphics. Growing and falling market graphs vector set. Collection of visualization finance chart and diagram information illustration
of100Next