
Images
Browse 6,241,100+ in index stock photos and images available, or start a new search to explore more stock photos and images.


Our creative library is free of AI-generated contentChoose your visuals with confidence knowing our creative library is free from AI-generated content, so your searches only return safe, high-quality visuals you can trust.


Business growth graph chart and success financial arrow up. Development graph profit and investment

Stock market changes, forex hologram with numbers and bar chart with candlesticks. Concept of economy and online trading. 3D rendering

Big data technology background. Motion of digital data flow. Transferring of big data. Artificial Intelligence Quantum Computer, big data, block chain, data flow, analysis
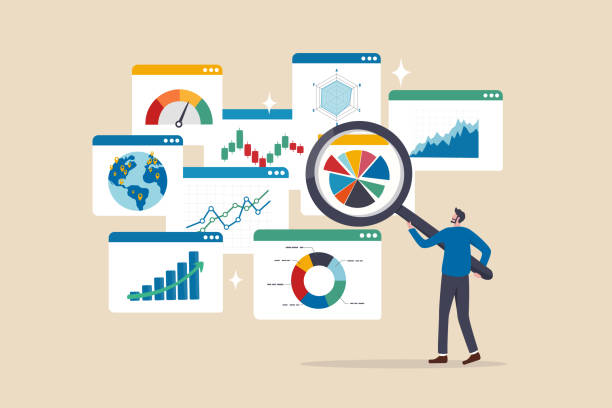
Containing data, web statistics, survey, prediction, presentation, cloud analysis and pie chart icons.

Digital background depicting innovative technologies in (AI) artificial systems, neural interfaces and internet machine learning technologies
Vector illustration in modern thin line style of analytics related icons: balance, charts, report, and other. Pictograms and infographics for mobile apps.

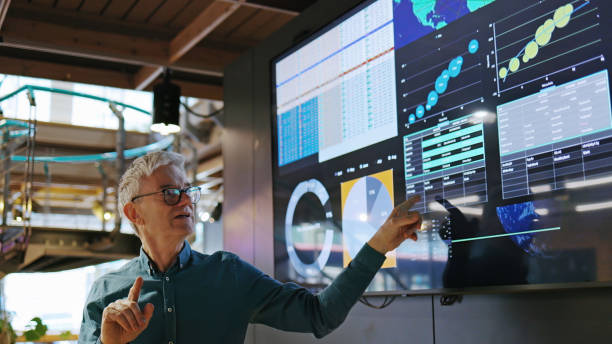
Stock image of a mature man conducting a seminar / lecture with the aid of a large screen. The screen is displaying graphs & data associated with the earth.

Technology and financial advisory services concept. Business teamwork and working on digital laptop computer with advisor showing plan of investment to clients at table office. Digital marketing.

Stock market investment data and analysis finance graph. Business financial chart with moving up arrow graph

Minimal high angle view at African American software developer working with computers and data systems in office
30 Data Analysis Outline Icons. Analytics, Arrow, Artificial Intelligence, Assessment, Bank, Bar Chart, Big Data, Business, Business Presentation, Business Strategy, Calculator, Chart, Cloud Computing, Communication, Computer, Computer Science, Dashboard, Data, Data Analysis, Data Science, Diagram, Document, Finance, Global Business, Goal, Graph, Investment, Magnifying Glass, Marketing, Money, Office, Payments, Performance, Science, Search, Search Engine Optimisation, SEO, Server, Statistics, Stock Market, Strategy, Target, Teamwork, Technology, Web Browser.

Data Analyst Using Data Analytics KPI Dashboard

Neural networks and artificial intelligence conceptual abstract background.

abstract network with random programming code, web and software development concept, futuristic technology, digital connectivity, cyber space (3d render)


Abstract connected dots and lines. Concept of AI technology, Motion of digital data flow. Communication and technology network concept with moving lines and dots. 3D rendering

Closeup group of Asian business people meeting discuss project plan and financial results in office. Marketing strategy analysis, stock market trading, financial consultant concept.

A team of multiethnic developers is meeting to review the data analysis of marketing from social media platforms.

Abstract Visualization of data flow and modern technology in circle graph form. 3D render

Close up of three people looking at financial data with graphs and charts. All their hands can be seen and one person is pointing with a pen. There is paperwork on the desk showing more finance information

Automation software to archiving and efficiently manage and information files. Document Management System (DMS).Internet Technology Concept
financial graph on technology abstract background represent financial crisis,financial meltdown

Stock image of a beautiful young woman studying a see through computer screen & contemplating.


Two data analysts Working on data analysis dashboard for business strategy

Data chart graph financial analysis and statistics abstract modern 3D background.
Clipboard icon set. Checklist on the clipboard line icon with checkmarks, checklist, document, gear, pencil. Checklist symbol. Editable stroke. Isolated.


Earth (focus on Europe) represented by little dots, binary code and lines - big data, global business, cryptocurrency 3D render
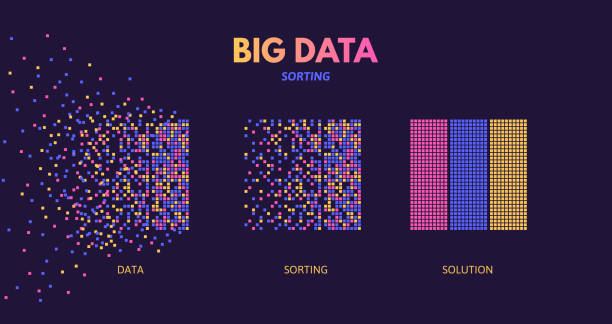
Big data sorting. Machine learning algorithm visualization, digital database analysis and chaotic data pattern recognition science vector concept illustration of visual algorithm, digital analysis
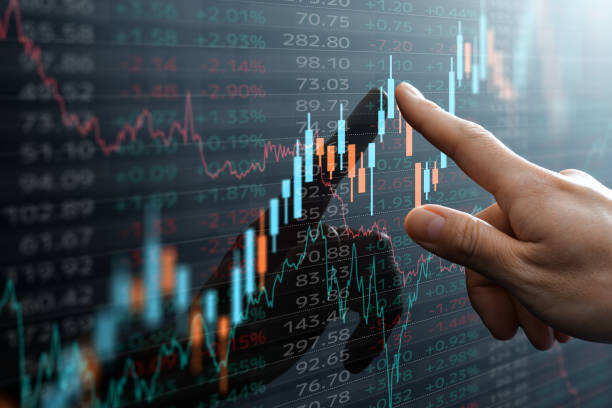

Business financial chart with moving up arrow graph.Stock market investment data and analysis finance graph.

Business finance data analytics graph. Advisor using KPI Dashboard on virtual screen.Financial management technology

Glowing lines on blue background. Abstract modern lines. Cool gradient shapes. Graphic concept for your design

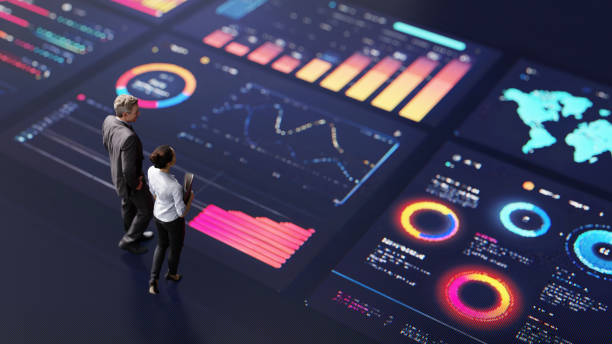
Abstract people standing on a large digital screen, analysing interactive data visualisations and charts for strategic planning. Representing teamwork, technology, and data-driven decision making in a corporate environment.


Beautiful design and fully editable Analytics, analysis, statistics, searching icon for commercial, print media, web or any type of design projects.
of100Next