Images
Browse 22,400+ performance dashboard stock photos and images available, or search for performance dashboard clipart to find more great stock photos and pictures.

This file EPS 10 format. This illustrationcontains a transparency .

Our creative library is free of AI-generated contentChoose your visuals with confidence knowing our creative library is free from AI-generated content, so your searches only return safe, high-quality visuals you can trust.

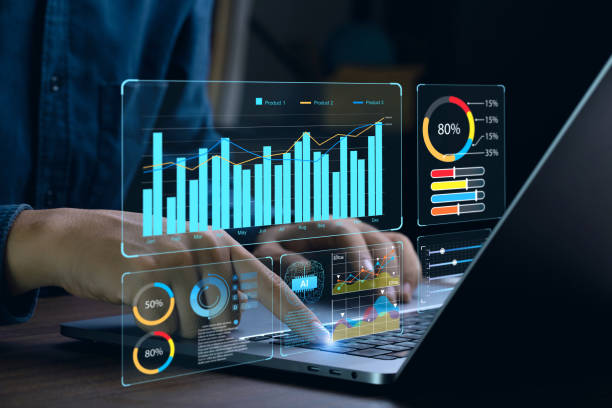
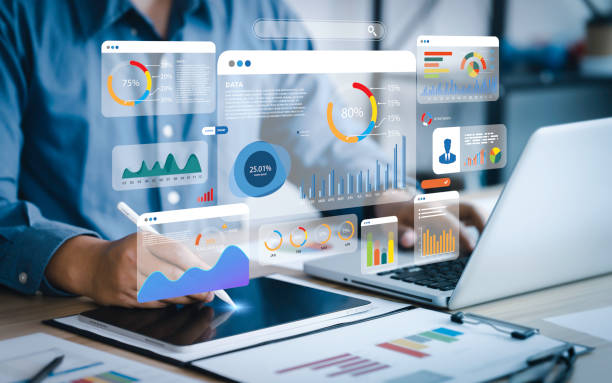
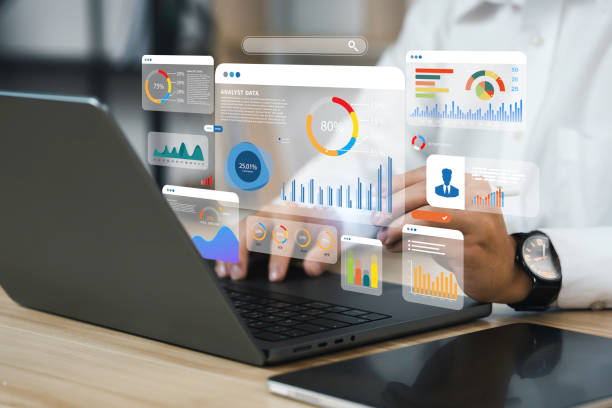
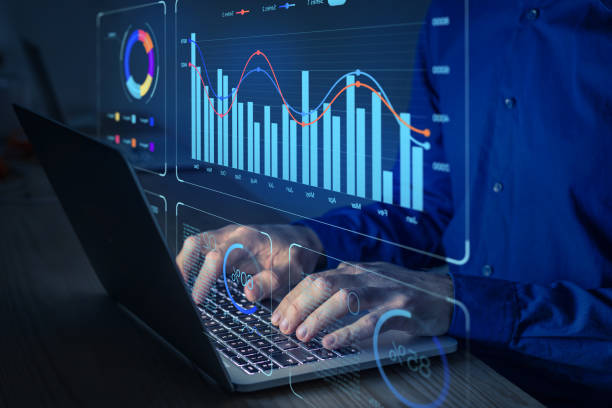
Analyst working on business Ai analytics dashboard with KPI, charts and metrics to analyze data and create insight reports for executives and strategical decisions. Operations and performance management.

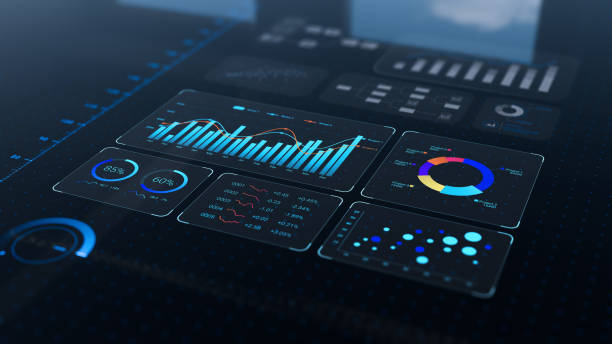
A high-tech dashboard displaying multiple charts, graphs, and ring visuals that reveal key metrics, trends, and market insights. This image conveys data-driven decision making and modern business intelligence.


Business man and business woman in a meeting at the office. There is a laptop on the table showing finance charts and graphs and the woman is holding a digital tablet. There is paperwork with finance chart and graphs.

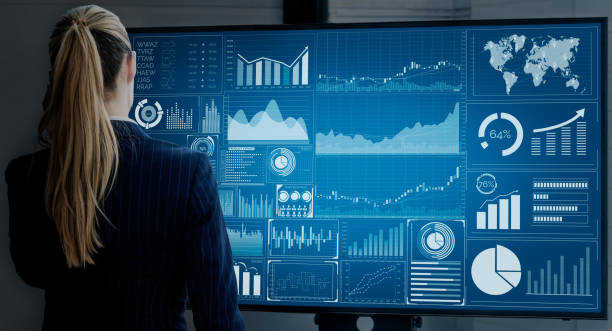
Two data analysts Working on data analysis dashboard for business strategy
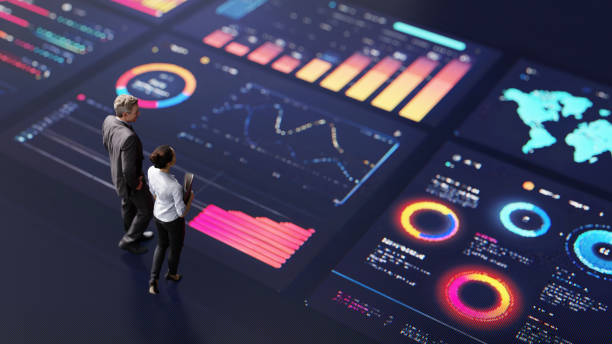
Abstract people standing on a large digital screen, analysing interactive data visualisations and charts for strategic planning. Representing teamwork, technology, and data-driven decision making in a corporate environment.

Close up of a laptop and document with data and finance charts and graphs. Group of business people in a meeting in then board room in the background. There are laptops and other technology on the table along with documents showing financial data

Close up of businessman using a laptop with graphs and charts on a laptop computer. The mans hands can seen typing in a keyboard. An office can be seen in the background
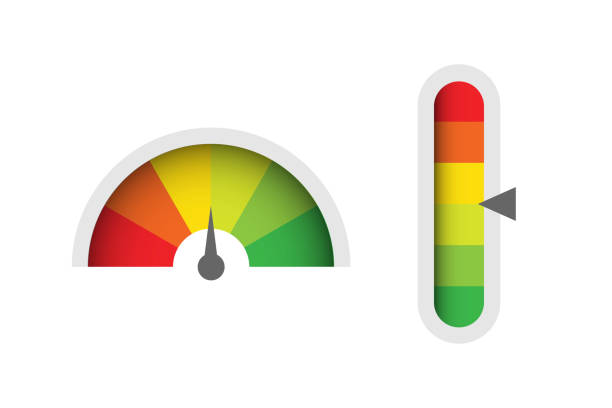
Infographic illustration for web design. Gauge vector icon.
30 Data Analysis Outline Icons. Analytics, Arrow, Artificial Intelligence, Assessment, Bank, Bar Chart, Big Data, Business, Business Presentation, Business Strategy, Calculator, Chart, Cloud Computing, Communication, Computer, Computer Science, Dashboard, Data, Data Analysis, Data Science, Diagram, Document, Finance, Global Business, Goal, Graph, Investment, Magnifying Glass, Marketing, Money, Office, Payments, Performance, Science, Search, Search Engine Optimisation, SEO, Server, Statistics, Stock Market, Strategy, Target, Teamwork, Technology, Web Browser.

Creative visual of business big data and finance analysis on computer showing concept of statistical investment decision making methodology, fintech and financial engineering .


entrepreneur reading financial report on dashboard, fintech and audit concept, monitoring revenue statement of performance of the company

Key Performance Indicator concept with a businesswoman, gauge, and target symbolizing growth and goals. Neubrutalism style
Data Analysis for Business and Finance Concept. Graphic interface showing future computer technology of profit analytic, online marketing research and information report for digital business strategy.

Modern, User-friendly Dashboard With Various Panels Displaying Infographics, Statistical Data, Metrics Such As Percentages, Financial Figures, And A Line Graphs For Business Analytics And Monitoring


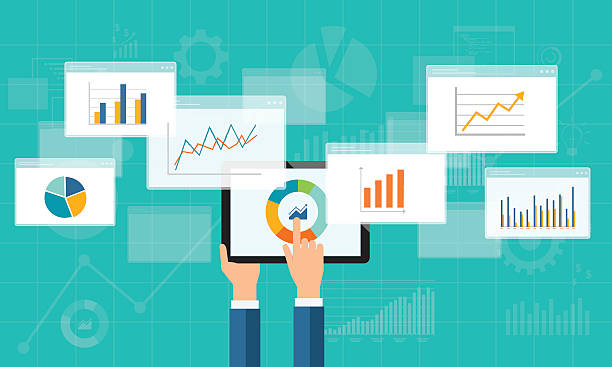
Vector illustration of business reporting dashboard screen concept of data analysis and research presentation
This file EPS 10 format. This illustrationcontains a transparency .
Performance Management Editable Stroke Vector Icon Set. SWOT Analysis, KPI, Chart, Analyzing, Efficiency, Performance, Business Target

Close up of businessman using a laptop with graphs and charts on a laptop computer. The mans hands can seen typing on a keyboard.
Simple Set of Speedometer Related Vector Line Icons. Contains such Icons as Car Speedometer, Odometer, Dashboard and more. Editable Stroke. 48x48 Pixel Perfect.

A close-up scene of a magnifying glass over a rising bar chart with line graphs, symbolizing analysis, growth, and data-driven insights in business and finance.

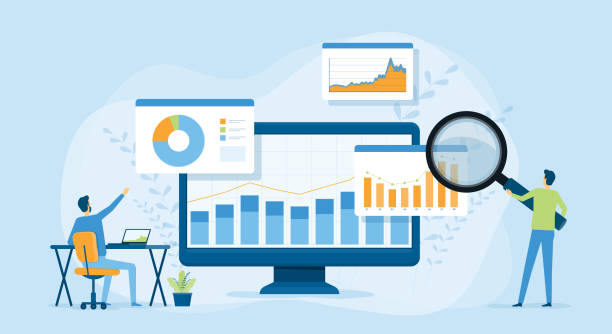
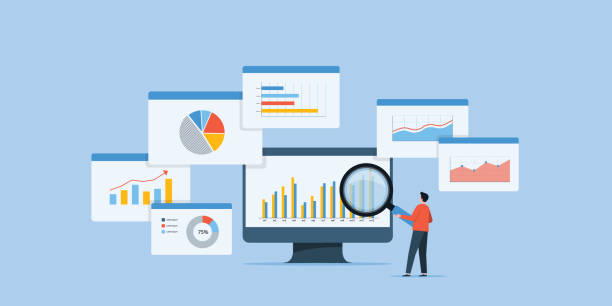
Data monitoring and analysis on desktop vector illustration. Cartoon tiny people with magnifying glass research graphs, charts and diagram on laptop screen, monitor financial report growth for trade

Close up of businessman using a laptop with graphs and charts on a laptop computer. The mans hands can seen typing on a keyboard.


Diverse group of students and teachers analyzing business analytics on screens.
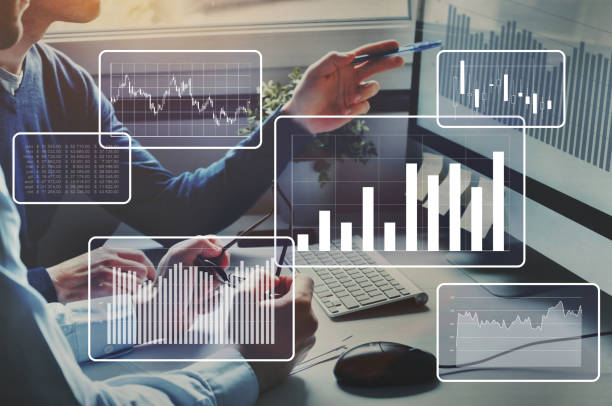
Big data analytics, financial charts, business team working on computer as background. Development and growth concept.
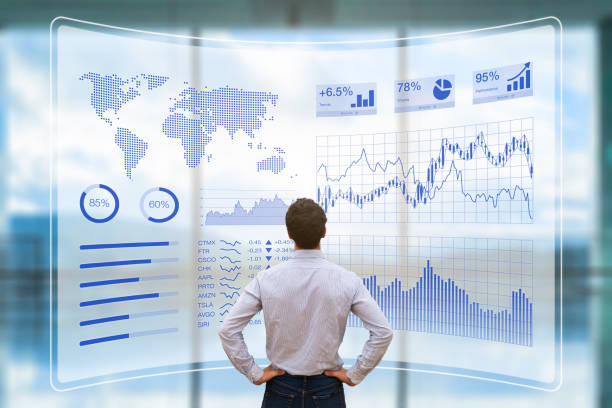
Person using a futuristic head up display (HUD) interface screen with data and key performance indicators (KPI) for business intelligence (BI) analytics, concept about financial dashboard, technology and virtual reality (VR)

Key Performance Indicator (KPI) using Business Intelligence (BI) metrics to measure achievement versus planned target, person touching screen icon, success
Speedometer, Gauge Editable Stroke Single Line Icon Design

flat business analytics graph on mobile device and finance investment planning background

Business man and business woman in a meeting at the office. There is a laptop on the table showing finance charts and graphs. They are looking and pointing at the computer

Big data analytics, business intelligence concept. Financial charts on virtual screen.

African Businessman Using Analytics Data KPI Dashboard Tech


A person interacts with a digital sales dashboard displaying various performance metrics and analytics.


3d analysis for web page design. Information analysis concept. Vector technology data. 3d render Vector illustration.

Download progress bar or round indicator of web speed. Sport car speedometer for hud background. Gauge control with numbers for speed measurement. Analog tachometer, high performance theme
Performance Management Editable Stroke Line Icon Set

Business analytics dashboard technology on computer and smartphone screen with key performance indicator (KPI) about financial operations statistics and return on investment, office worker

of100Next