Data monitoring and analysis on desktop vector illustration. Cartoon tiny people with magnifying glass research graphs, charts and diagram on laptop screen, monitor financial report growth for trade
Browse 24,100+ progress dashboard stock photos and images available, or start a new search to explore more stock photos and images.
Data monitoring and analysis on desktop vector illustration. Cartoon tiny people with magnifying glass research graphs, charts and diagram on laptop screen, monitor financial report growth for trade

hands of car driver on steering wheel, road trip, driving on highway road
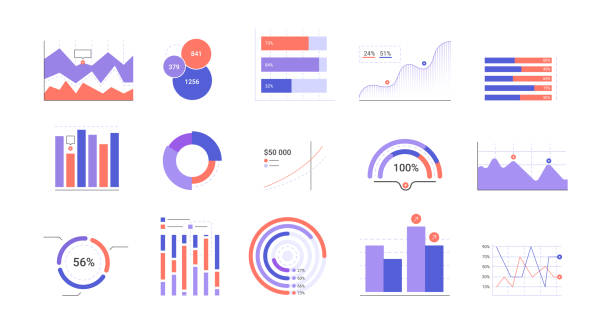
Dashboard UI and UX Kit. Control center design. Infographics design vector and marketing icons can be used for workflow layout, diagram, annual report, web design.

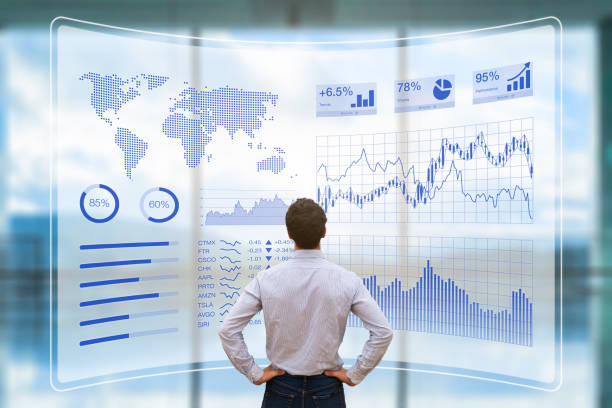
Big data analytics, business intelligence concept. Financial charts on virtual screen.
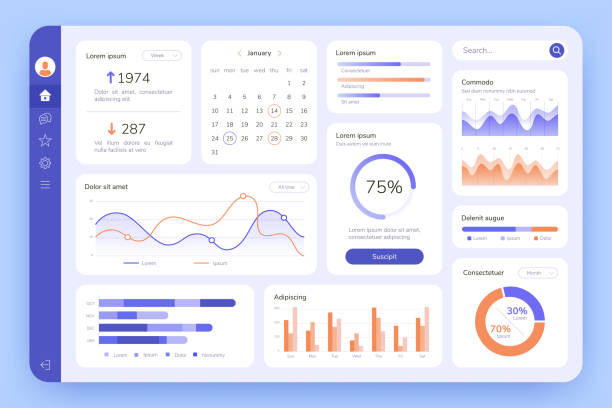
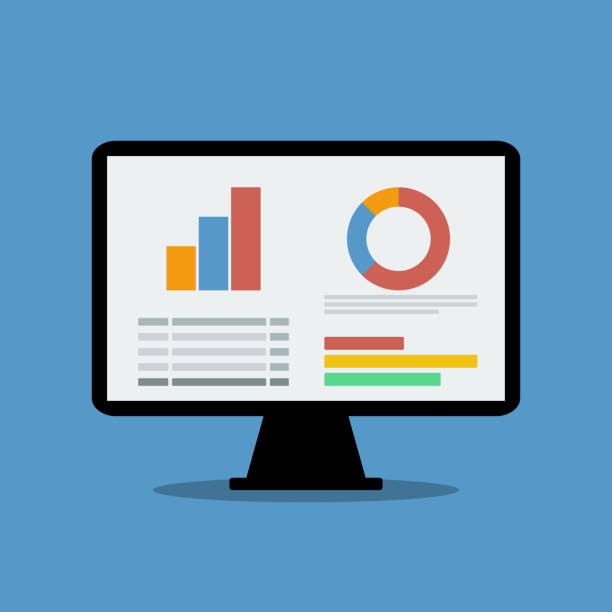
Dashboard. UI infographic, data graphic and chart. Screen with business analytics. Admin statistical software, web interface vector template. Illustration statistical infographic data screen
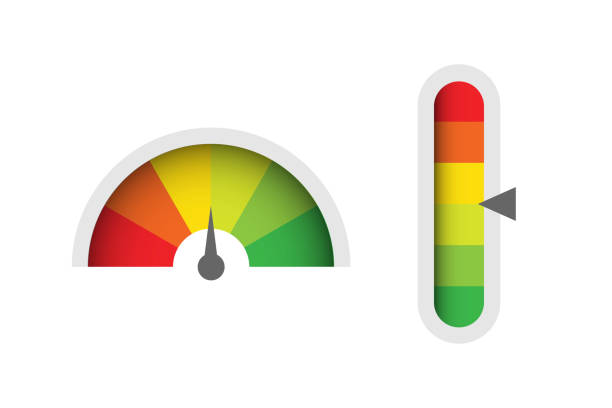
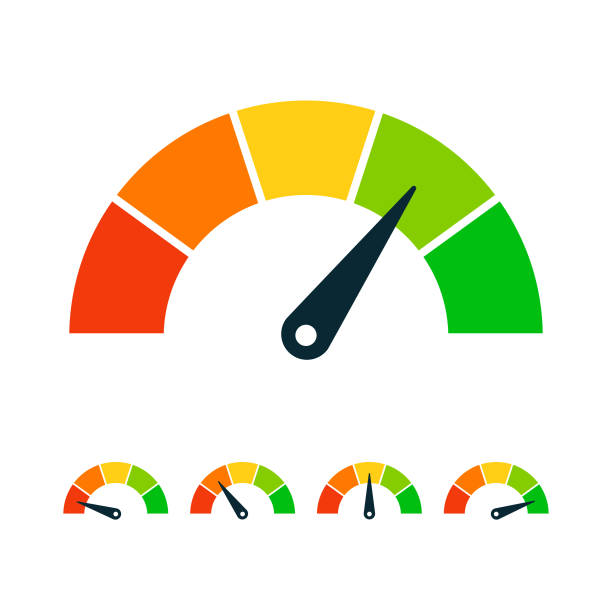
Infographic illustration for web design. Gauge vector icon.

A high-tech dashboard displaying multiple charts, graphs, and ring visuals that reveal key metrics, trends, and market insights. This image conveys data-driven decision making and modern business intelligence.

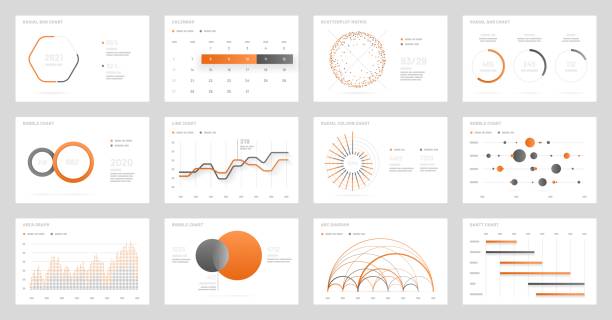
Vector illustration of business reporting dashboard screen concept of data analysis and research presentation
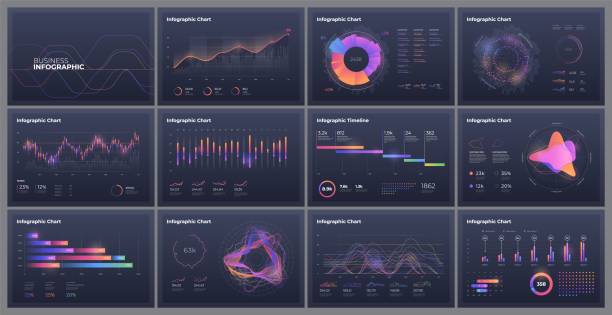
Dashboard infographic template with big data visualization. Pie charts, workflow, web design, UI elements.
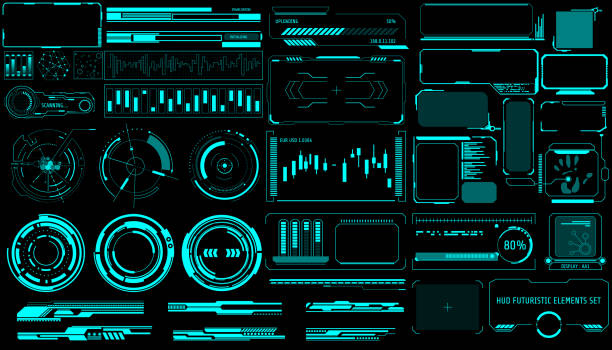
HUD Virtual Futuristic Elements Set Vector. Green Object Abstract Graphic For User Interface Control Panel Game Apps Illustration.
Dashboard colorful speedometer icons set. Tachometer icon isolated. Performance indicator sign. Car speed. Fast internet speed sign. Stock flat vector elements.

Big data analytics, financial charts, business team working on computer as background. Development and growth concept.

Close-up - Hand of man driving car on the road.
30 Data Analysis Outline Icons. Analytics, Arrow, Artificial Intelligence, Assessment, Bank, Bar Chart, Big Data, Business, Business Presentation, Business Strategy, Calculator, Chart, Cloud Computing, Communication, Computer, Computer Science, Dashboard, Data, Data Analysis, Data Science, Diagram, Document, Finance, Global Business, Goal, Graph, Investment, Magnifying Glass, Marketing, Money, Office, Payments, Performance, Science, Search, Search Engine Optimisation, SEO, Server, Statistics, Stock Market, Strategy, Target, Teamwork, Technology, Web Browser.

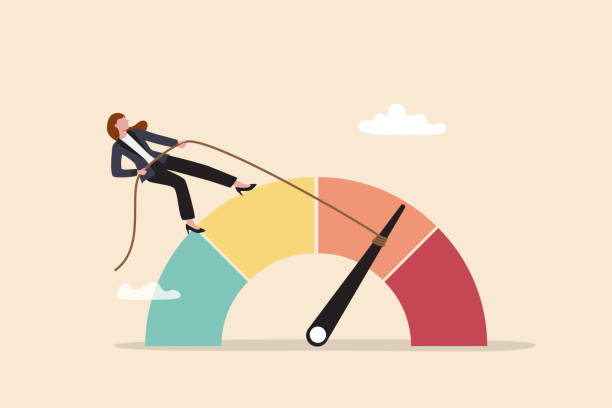
Key Performance Indicator (KPI) using Business Intelligence (BI) metrics to measure achievement versus planned target, person touching screen icon, success
Infographic Elements Line Icons. Pixel perfect. Editable stroke. Vector illustration.

HUD navigation background. City map navigation screen interface backdrop with compass, graphs and map points on computer screen. Car trip or delivery destination and location route map on city streets
Daily streak counter. Habit tracker interface with progress bar, steps goal and reward. Fitness or learning challenge milestone for mobile app. Health dashboard Dark UI.
Big set of infographic tools. Use in presentation templates, mobile app and corporate report. Dashboard UI with big data visualization.

Isometric Chart and Diagram collection. Vector illustration.

Hawaii road trip - car hula dancer doll dancing on the dashboard in front of the ocean. Tourism and travel freedom concept.

driving on highway road, closeup hands of car driver on steering wheel, road trip at sunset

Vector illustration of business reporting dashboard screen concept of data analysis and research presentation with side navigation bar and chat functionality
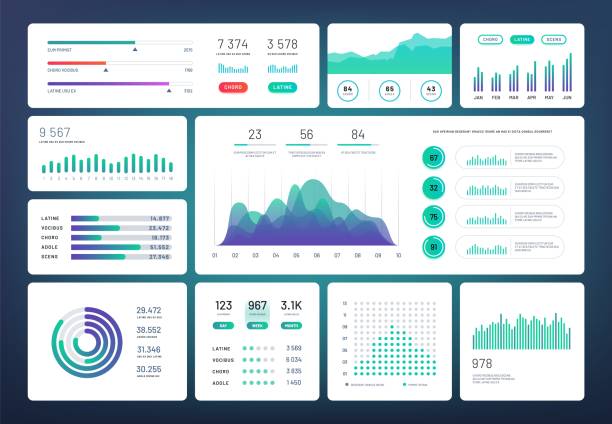
Infographic dashboard template. Simple green blue design of interface, admin panel with graphs, chart diagrams. Vector infographics. Interface panel admin, infographic data presentation, economic ui
Person using a futuristic head up display (HUD) interface screen with data and key performance indicators (KPI) for business intelligence (BI) analytics, concept about financial dashboard, technology and virtual reality (VR)
Set of chart and diagram small line vector icons. Editable stroke.
Stock price broker window thin line icon. Browser with statistic diagram on monitor. Multimedia vector design concept, outline style pictogram on white background, use for web and app. Eps 10
Risk icon on speedometer. High risk meter. Vector illustration.

A simplified user interface with charts, graphs, and data on a computer screen. Ideal for data analysis, business intelligence, performance tracking, reporting, and presentations. Modern, clean

Graph chart dashboard. Data analysis UI, Web application interface with line bar pie graphs charts, business statistics and financial analytics presentation. Vector graph layout.
Vector line icon set appropriate for web and print applications. Designed in 48 x 48 pixel square with 2px editable stroke. Pixel perfect.
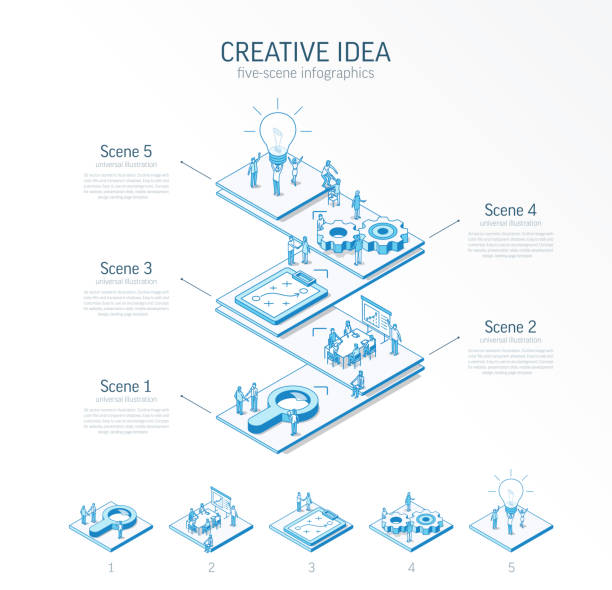
3d line isometric innovative creative idea infographic template. Startup, teamwork presentation layout. 5 option steps, process parts, growth concept. Business people team. Bulb, grow up, plan icon

Performance data visualization abstract concept vector illustration set. Business intelligence dashboard, balanced scorecard, business intelligence, KPI metrics, strategic goals abstract metaphor.
Loading process and status bar icons, HUD interface. Vector Sci Fi digital futuristic elements for dashboard, technology style neon glowing ui navigation for game menu design or web site data load

3d realistic speedometer. Isolated on white background. Vector illustration.
Speedometer, Gauge Editable Stroke Single Line Icon Design

A person working on laptop displaying data analytics dashboards with charts and graphs, sitting at wooden desk with documents, coffee cup, and another person using laptop in background
Dashboard icon outline style. Thin line creative Dashboard icon for logo, graphic design and more.