Time series analysis with data points sequence calculation outline diagram. Labeled educational scheme with statistics research method over time vector illustration. Analytic forecasting or analytics
Browse 2,400+ time series graph stock photos and images available, or start a new search to explore more stock photos and images.
Time series analysis with data points sequence calculation outline diagram. Labeled educational scheme with statistics research method over time vector illustration. Analytic forecasting or analytics
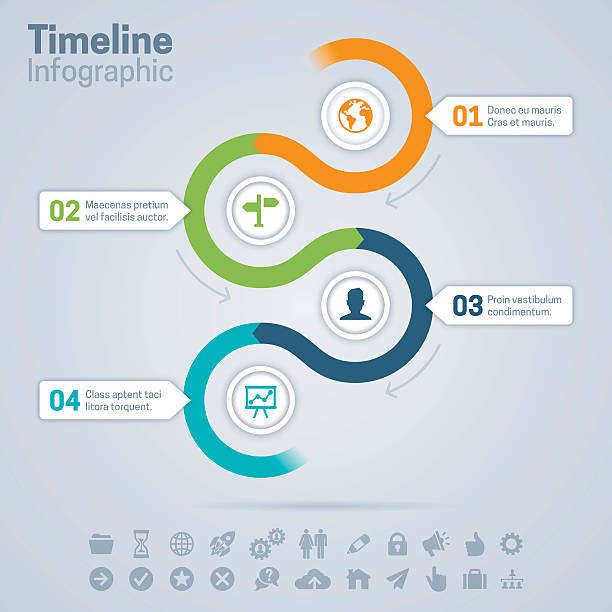
Timeline flowing infographic concept with space for your content. EPS 10 file. Transparency effects used on highlight elements.
Arrows workflow steps. Global business process graph, step to success diagram and arrow timeline vector infographic chart. Workflow arrow progression steps graphic illustration
Process diagram. Flowchart graphic template, evolution sequence infographic, simple option process chart. Vector illustration step timeline diagram presentation elements flowchart
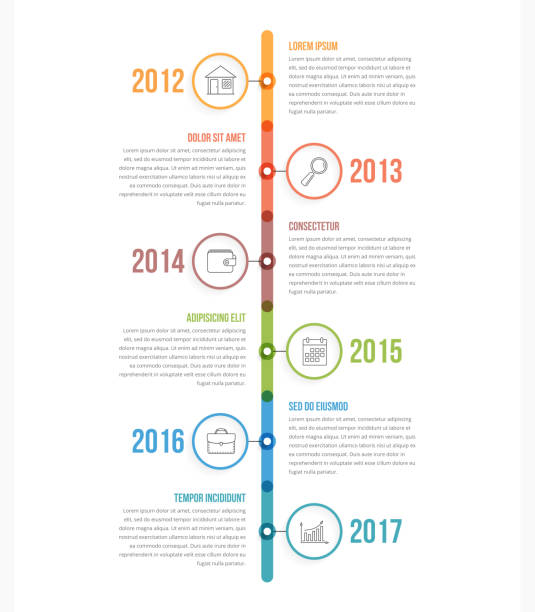
Vertical timeline infographics template with colorful circles, workflow or process diagram, vector eps10 illustration
Modern business infographic for company process with 3d colorful pie chart and flat icons. Easy to use for your website or presentation.

Timeline line infographic concept with space for your content. EPS 10 file. Transparency effects used on highlight elements.
Arrow steps infographic concept with space for your copy. EPS 10 file. Transparency effects used on highlight elements.

Business timeline or workflow diagram. EPS 10 file. Transparency effects used on highlight elements.

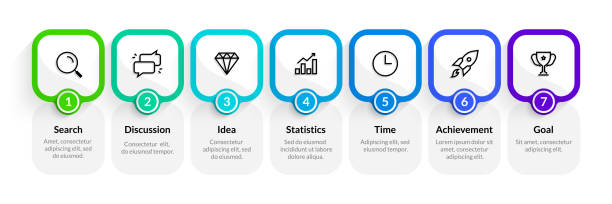
Line flow infographic. 7 steps work process minimalist graph, productivity workflow banner. Vector 7 options presentation graphic

digital scoreboard The figure is 0.15. Neon numbers. Neon light
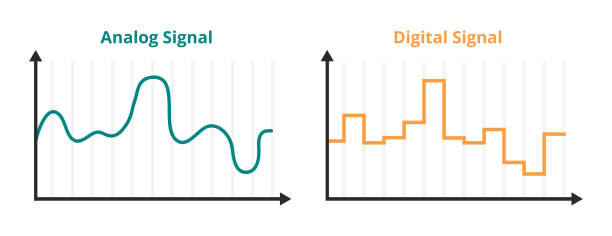
Vector scientific or educational scheme or diagram of the analog signal and digital signal isolated on a white background. Continuous time-varying signal and the discrete, not continuous signal used to carry data. Physics, technology.
Arrow steps timeline or workflow diagram. EPS 10 file. Transparency effects used on highlight elements.

Business timeline or workflow diagram. EPS 10 file. Transparency effects used on highlight elements.

Driving Business Growth Through Real-Time Market Analysis and Strategic Intelligence

Business growth timeline concept infographic with space for your text and extra icons and symbols. EPS 10 file. Transparency effects used on highlight elements.

A detailed 3D rendering featuring the word "Workflow" in bold text at the center, with a workflow diagram and flowchart positioned in front. The diagram showcases the process of task management and work progression, illustrating connections and steps in a clear and visually engaging manner. Perfect for depicting concepts like project management, business processes, and efficiency.
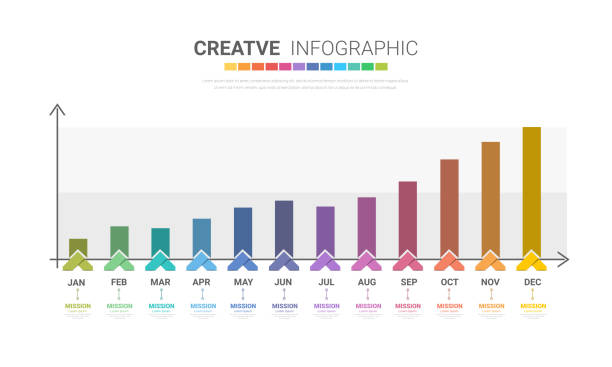
Bar graph for 12 months and line graph templates, business infographics, project timeline with seven stages, infographic template, vector eps illustration.

Step line infographic. 5 step square presentation graphic, business productivity timeline elements. Vector modern options flow milestone infographic
Infographics design vector and marketing icons. Can be used for process diagram, presentations, workflow layout, banner, flow chart, info graph.

Four steps infographics - can illustrate a strategy, workflow or team work.

Forming, storming, norming and performing group management outline diagram. Labeled educational scheme with group leading process framework for high efficiency and productivity vector illustration.

Company milestones path vector infographic plot template for presentations. Flat realistic 3D illustration
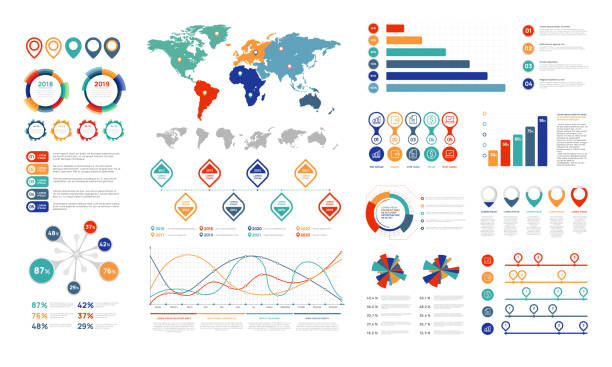
Flat infographic elements. Presentation chart element, percent infochart business graph banner, diagram and infograph flowchart. Charts for infographics vector isolated symbols set

Infographic design template, Timeline diagram calendar 12 months, 12 options or steps template, presentation. Vector illustration.
vertical timeline milestone infographic template banner with round rectangle and sharp arrow bottom direction with 3 point list information for slide presentation vector
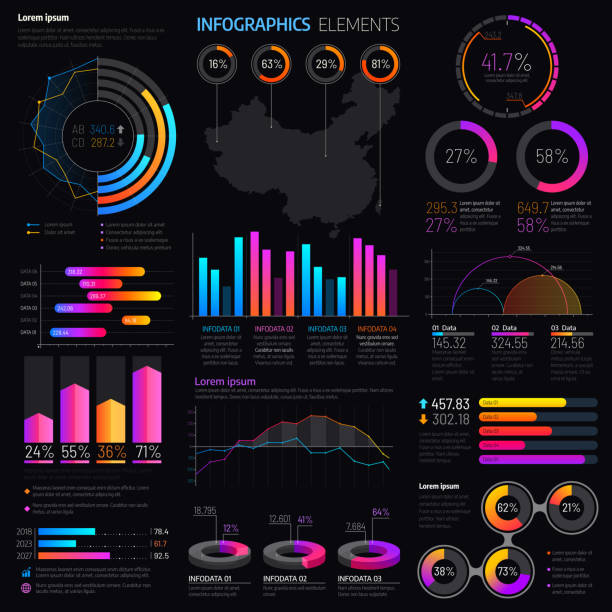
Infographics elements with vector graphs and charts. Business presentation info graphic templates with bar graphs, statistic data step and pie charts, timeline, process and option diagrams

Abstract clock chart with three action steps, colored elements of infographics. illustration

vertical timeline milestone infographic template banner with big circle and rectangle pointy arrow with 4 point list information for slide presentation vector

Modern line concept can be used for diagram, business, web, banner, workflow layout, presentations, chart, levels. Data visualization.

Timeline for 1 year, 12 months, infographics all month planner design and Presentation business can be used for workflow, process diagram, flow chart, EPS vector.

Step infographic. Process flow chart, timeline graphic, workflow line diagram, 7 steps business options. Vector line infographic circle

Creative presentation concept design for timeline infographics in 6 steps. Vertical option banner. Graphic resource elements suitable for workflow, annual report, milestone, business report.

Vector film countdown on an abstract background. Frame 2 of 10.

Set of infographic timeline,road map,ideas,strategy on white background,vector illustration.Milestone presentation layout design for plan,steps,process,history,workflow.

A conceptual illustration shows a sustainable growth using plant from sprout to blooming