36 Graph and Diagram Icons - Line Series
Illustrations
Mathematics Graph stock illustrations
Browse 49,600+ mathematics graph stock illustrations and vector graphics available royalty-free, or start a new search to explore more great stock images and vector art.
Most popular

I Love Maths horizontal vector thin line banner. Math concept concept linear illustration


Graph paper, checkered background vector illustration isolated on white backdrop. Light blue grid notebook sheet texture, back to school banner template
Finance line icons. Money and bank icon set with editable stroke

Graph paper background vector blue plotting millimeter drawing ruler line guide
A set of flat design styled science and technology icons with a long side shadow. Color swatches are global so it’s easy to edit and change the colors.
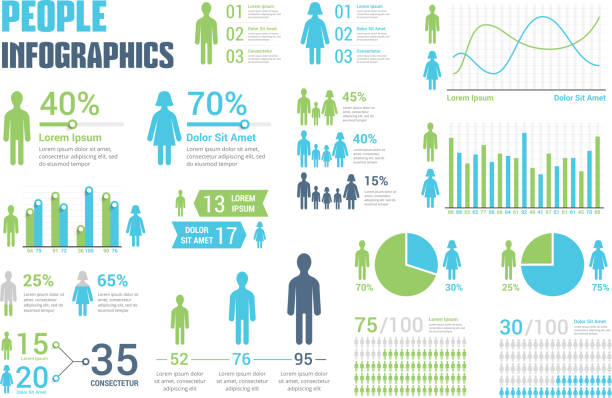
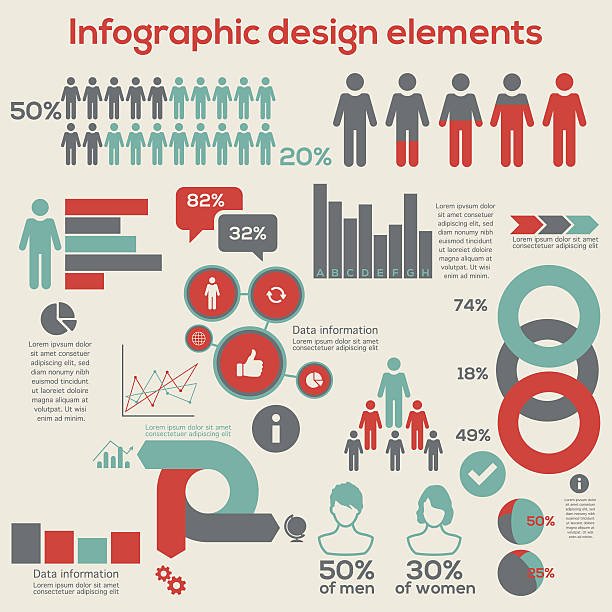
People infographics for reports and presentations - percents, bar and line graphs, pie charts, vector eps10 illustration
Simple Set of Increase and Decrease Related Vector Line Icons. Contains such Icons as Finance Chart, Abstract Graph, Trend and more. Editable Stroke. 48x48 Pixel Perfect.
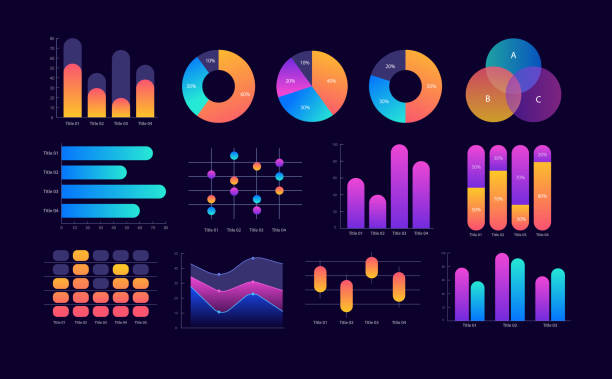
Business statistics and analytics infographic chart design template set for dark theme. Research. Visual data presentation. Bar graphs and circular diagrams collection. Myriad Pro font used

Vector illustration of pink columns sorted as a normal distribution with a curve. Statistical illustration, which is usable in economics, statistics, math, natural sciences such as chemistry, physics, biology, etc.


Business idea hand drawn doodle illustration isolated on white background. Vector doodle illustration with editable stroke/outline.

Square grid on paper seamless pattern. Millimeter paper sheet background.

Scientific molecule background for medicine, science, technology, chemistry. Science template wallpaper or banner with a DNA molecules. Dynamic wave flow DNA. Molecular vector illustration

seamless Grid pattern background
Modern modern infographic vector template with statistics graphs and finance charts. Diagram template and chart graph, graphic information visualization
Seamless Blue mosaic grid graph paper background vector illustration

Graph with calculated numbers on chalkboard as seamless background.
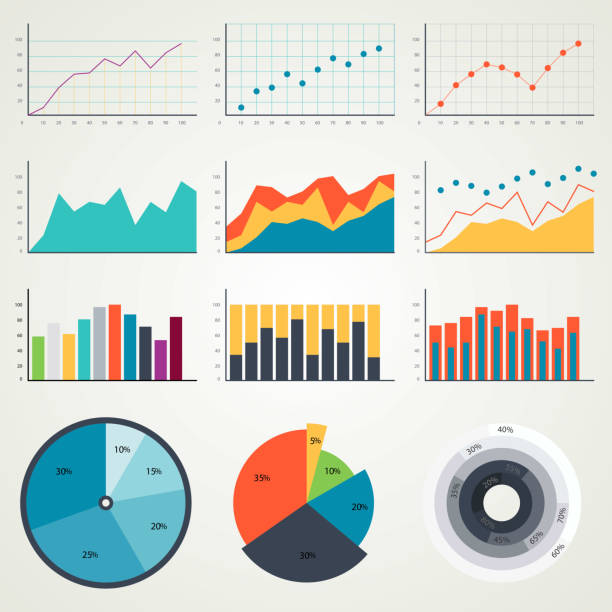
Set of elements for infographics, charts, graphs and diagrams. In color. Vector illustration
graph paper. seamless pattern. architect background. grey millimeter grid. vector illustration

India, Analyzing, Annual Report, Big Data, Business


Blueprint background. Vector illustration

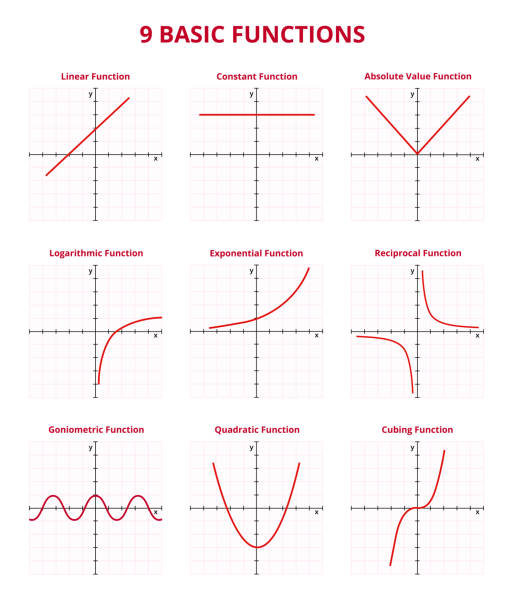
Vector set of graphs or charts with 9 basic mathematical functions with grid and coordinates isolated on a white background. Linear, constant, absolute value or modulus, logarithmic, exponential, reciprocal, goniometric or trigonometric, quadratic or polynomial, and cubing, cube, or cubic function.
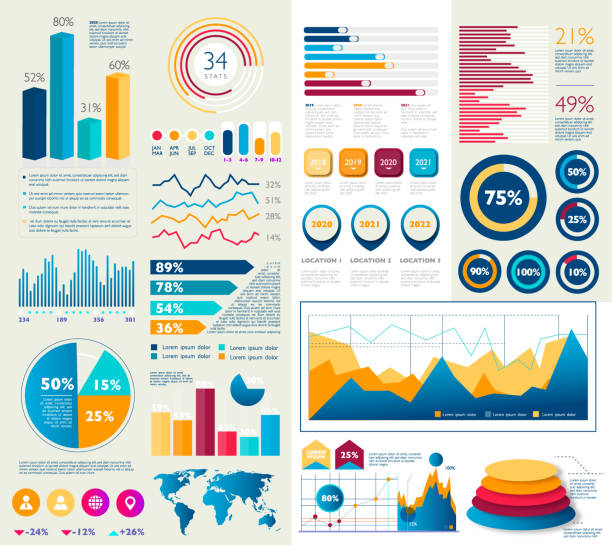
Business infographic colorful designs - Illustration
Growing graph icon, vector isolated flat style symbol.

Circle progress bar set with percentage text from 0 to 100 percent. Turquoise blue, light grey. Infographic, web design, user interface. Flat design. Vector illustration, no transparency, no gradients
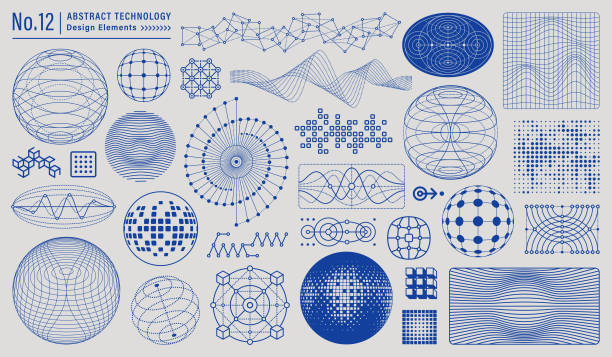
Collection of abstract technology design elements. Wire mesh geometric line art with editable stroke.

Abstract infographics visualization. Big data code representation. Futuristic network or business analytics. Graphic concept for your design.


Cover design. Set of 3 modern simple background vector illustration flat style in a4 format. Suitable for poster, cover, ads, social banner or flyer
16 Increase and Decrease Line Icons. Arrow, Benefits, Charity Benefit, Chart, Contrasts, Crash, Currency, Development, Diagram, Direction, Downloading, Falling, Finance, Finance and Economy, Financial Report, Graph, Growth, High Up, Interest Rate, Investment, Lowering, Making Money, Mathematics, Moving Down, Moving Up, Negative Emotion, Performance, Planning, Pointing, Positive Emotion, Presentation, Price, Reduction, Sharing, Stock Market and Exchange, Stock Market Data, Success, Traffic Arrow Sign.

Vector mathematical illustration of function y=cot x. The cotangent function is shown in a graph, chart. trigonometric or goniometric functions. The icon is isolated on a white background. Law of cotangents, triangle, geometry.


Vector line icon set appropriate for web and print applications. Designed in 48 x 48 pixel square with 2px editable stroke. Pixel perfect.

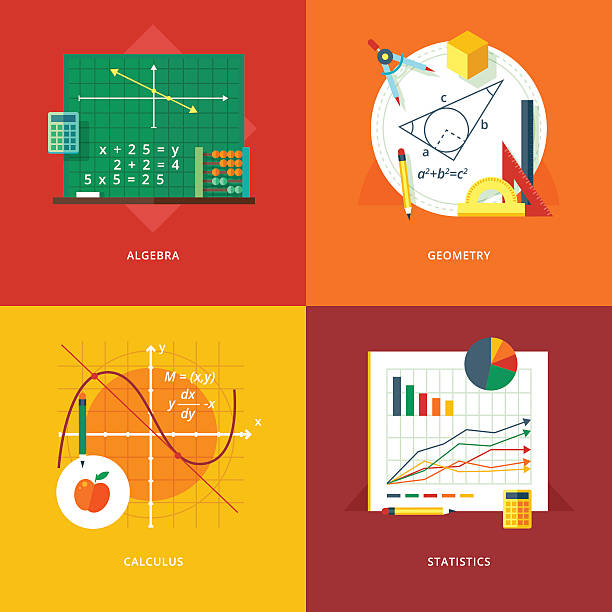
Set of flat design illustration concepts for algebra, geometry, calculus, statistics. Education and knowledge ideas. Mathematic science. Concepts for web banner and promotional material.
Mathematics science icon set in line style. Math symbols collection. Vector editable illustration.
A set of chart and graph icons. File is built in the CMYK color space for optimal printing. Color swatches are global so it’s easy to edit and change the colors.
Graph icon. Chart and Graph line icons set. Vector illustration. Editable stroke

Vector circle chart design, modern template for creating infographics, presentations, reports, visualizations. Global swatches.

Cosine and sine wave lines on bidimensional plane. Mathematics function graph. Checkered worksheet background. Cartesian coordinate system with two perpendicular axes. Vector graphic illustration


Infographic vector design elements with sketched info charts. Timeline and bar graph, pie and step chart with option tag, stacked diagram with percentages and statistic world map

Chalk set of mathematical figures, functions, formula, calculation and equation. Hand drawn white chalked geometric triangle, square, cones and function graphs are drawn on green school chalkboard

Overlapping circles, ellipses representing orbitals, wave interference, and magnetic field interactions, principles of electromagnetic theory. Science. Modern aesthetics, minimalist art. Vector design
Previous
of 100Next