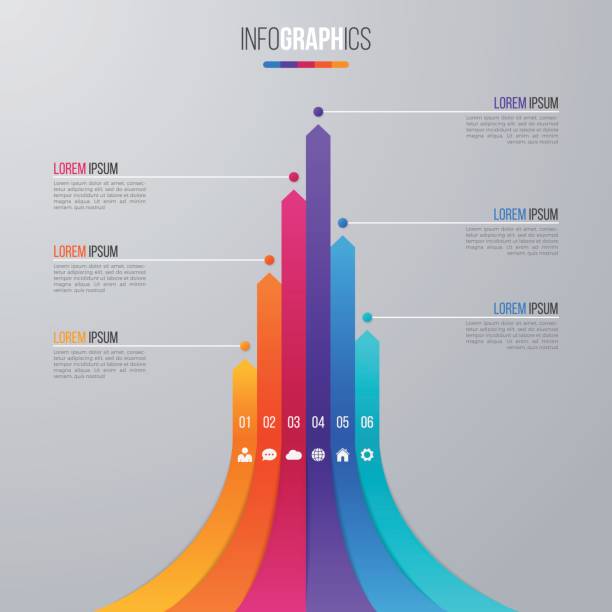
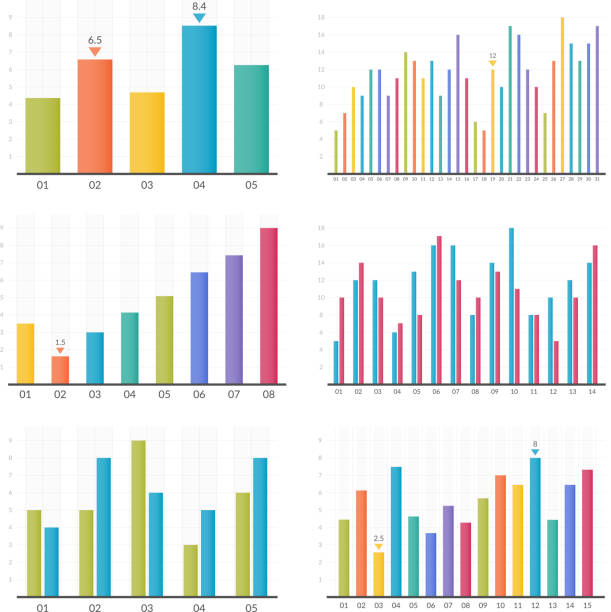
Bar chart infographic template for data visualization with 6 options. Easy to edit and to build your own chart.
Browse 5,900+ vertical bar graph stock illustrations and vector graphics available royalty-free, or start a new search to explore more great stock images and vector art.
Bar chart infographic template for data visualization with 6 options. Easy to edit and to build your own chart.

Vector flat design statistics vertical blue columns graph infographic template. Blue folded papers as columns in simple graph template
Isometric vertical progress bars, percentage indicators or charts set. Turquoise blue glass or water columns isolated on white. Flat design elements. EPS 8 vector illustration, no transparency
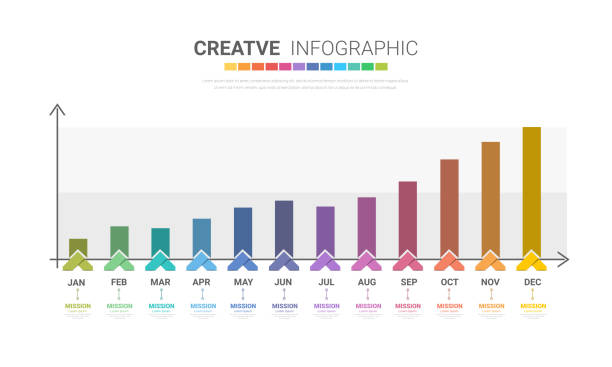
Bar graph for 12 months and line graph templates, business infographics, project timeline with seven stages, infographic template, vector eps illustration.
Colorful bar graphs, six different styles, vector eps10 illustration
Vertical Arrow Symbols Moving Up, Abstract Background
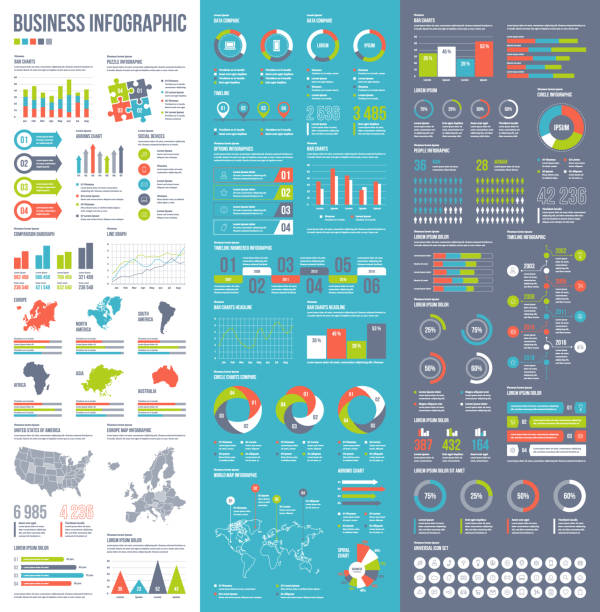
Set of vector business infographic elements for printed documents, website or presentation slides.
Information Graphics and charts, vector illustration. Bar Graph, Line Graph, Chart, Data, Web Page

Set of transparent bar graphs, business infographics, vector eps10 illustration

Bar Chart infographic banner with free space for text description with modern color and style - vector illustration

Graph And Diagram Colored glyph icons flat - Vector

Abstract background with colorful vertical geometric shapes

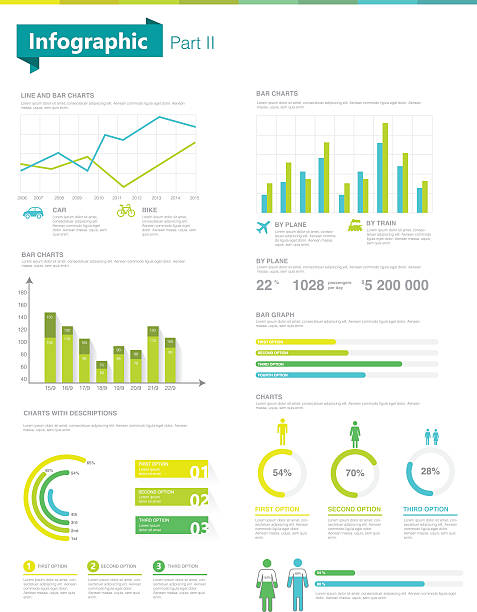
Infographic elements - circle diagram, timeline, bar graphs, design elements with numbers, workflow, steps, options, timers, process charts, vector eps10 illustration

Tall Technology striped background with geometric shapes and diminishing perspective

Infographic template for business. 7 Steps Modern Chart Element diagram with comparison graph, presentation vector infographic.

Abstract background with blue vertical geometric shapes

Futuristic technology background and striped lines

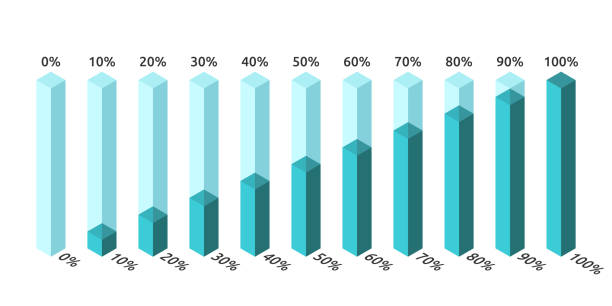
Percentage data charts perfect for infographics. 10%, 20%, 30%, 40%, 50%, 60%, 70%, 80%, 90%, 100%

Infographic template for business. Modern Timeline diagram calendar with gantt chart, presentation vector infographic.

Mobile telephone mobile device cell phone showing data and statistics dashboard held by a person in their hand.
Software Interface - thin line vector icon set. 20 linear icon. Pixel perfect. Editable outline stroke. The set contains icons: Copy, Paste, Move, Check Mark, Magic Wand, Layers, Grid, Text Edit, Grid Edit, Downloading, Paint, Scale, Expand, Recovery, Link.

Vector illustration of business success. Illustration of a grid.

Infographic template for business. 5 Steps Modern Timeline diagram, presentation vector infographic.

A person using a mobile device digital tablet.

infographic, icon, business, world map, timeline

illustration of sales growth
Line Graph, Bar Graph, Graph, Chart, Pie Chart

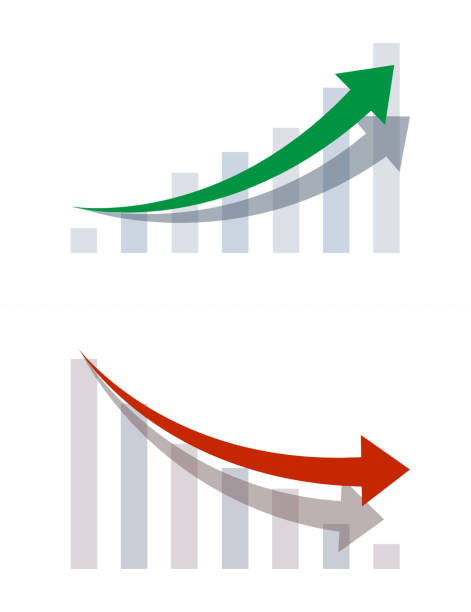
Vector illustration of three dimensional bar graph with shadows and arrow showing continued growth.

Infographic charts and diagrams - set of modern vector isometric elements isolated on white background. High quality colorful images of different graphs. Business analytics, statistics concept
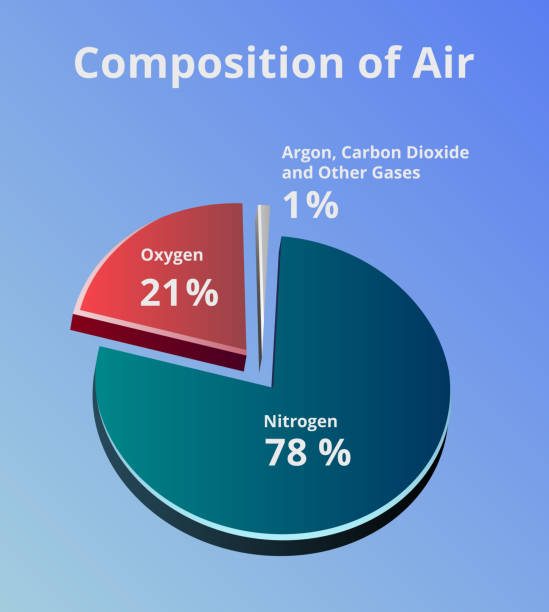
Vector 3D pie chart with the composition of air. Composition of Earth's atmosphere where is 78 % of nitrogen, 21 % of oxygen, and 1 % of other gases such as carbon dioxide and argon on blue background.

Friends playing a board game. Vector illustration
HUD elements mega set pack. Dashboard display virtual reality technology screen. Abstract hud ui gui future futuristic screen system virtual design. Geometric shapes, graphs, charts data analyzing,bars.
Vector minimalist cv / resume template with nice typogrgaphy design.
Data Analysis Icons with searching, pie chart and infographic symbols

Businessman and businesswoman looks through a telescope. They fly high up in the clouds, like the arrows, reach fame, wealth and success in the world of business. Vector business concept illustration.