Vector illustration of the pie charts elements
Browse 940+ 25-pie-graph stock photos and images available, or start a new search to explore more stock photos and images.
Vector illustration of the pie charts elements

Close-up of a business professional's hands reviewing and analyzing colorful data charts and graphs on documents beside a laptop computer.
Pie chart percentage icons set. Segment infographic. Circle graph statistic diagram. 25,50,60,75 slice element. Data information. Finance document presentation. Management report. Vector illustration.

Businesswoman giving presentation in conference room during meeting.

Woman presenting SWOT analysis in conference room. Blurred attendees in suits. Could be company or product launch.

Vector illustration of the set of circle percentage diagrams.

Circle graph in yellow, blue, green and red made from wooden blocks meaning 25 percent.

Stress At Workplace In Office. Business Headache
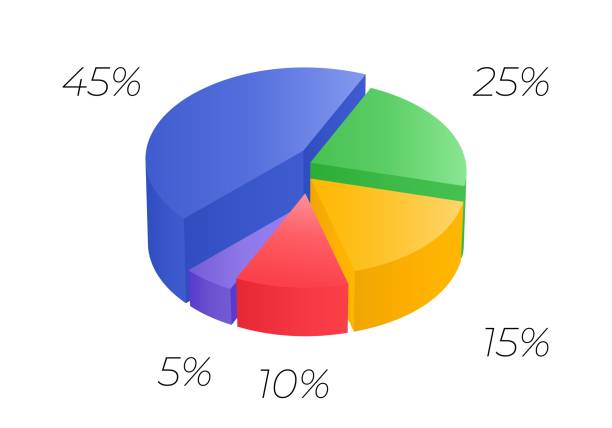
Isometric cycle diagram for infographics. Vector chart can be used for graph, report, presentation, brochure, web design. 3d pie.

Picture of two business people talking.

Happy businesswoman giving a fist bump to her coworker at the office - business team concepts

Smiling Pregnant Woman Holding digital tablet and giving presentation in office. Pointing to pie chart with pencil.
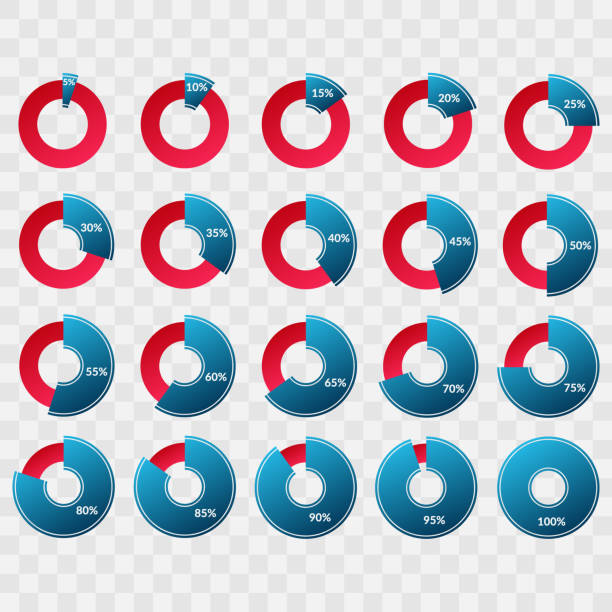
0 5 10 15 20 25 30 33 35 40 45 50 55 60 65 70 75 80 85 90 95 100 percent pie and arrow charts. Vector percentage infographics. Circle and line diagrams isolated. Set of business icon illustrations

Closeup, businessman showing the business pie chart report via digital tablet computer to businesswoman.

The team lead helps train the new hire personnel that joined the team recently.

Vector illustration pie chart elements.

Percentage data charts perfect for infographics. 10%, 15%, 25%, 35%, 50%, 65%, 75%, 85%, 100%

Percentage vector infographics. 0 5 10 15 20 25 30 35 40 45 50 55 60 65 70 75 80 85 90 95 100 percent blue pie charts. Business illustration
Pie chart percentage icons set. Circle graph statistic diagram. Segment infographic. 25,50,60,75 slice element. Data information. Finance document presentation. Management report. Vector illustration.

Person analyzing pie chart on smartphone at desk, a close up.

Business colleagues pointing on whiteboard while discussing new work plan at office meeting

Vector Infographics. Pie, graph, line charts, arrows, steps, 5 10 15 20 25 30 35 40 45 50 55 60 65 70 75 80 85 90 95 100 percent circle diagrams.

Confident businesswoman discussing future ideas with colleagues in board room. Female professional is gesturing while giving presentation in office. Executives are in businesswear at workplace.

Person analyzing financial data displaying on a digital tablet screen in an office setting

Successful business woman working on a marketing strategy at the office and drawing graphs on a glass board

Aboriginal businesswoman talking on a meeting with a chart document.

Smiling Pregnant Woman Holding digital tablet and giving presentation in office. Standing with legs crossed and smiling.