Images
Crm Dashboard Pictures, Images and Stock Photos
Browse 1,300+ crm dashboard stock photos and images available, or start a new search to explore more stock photos and images.
Most popular

close-up of a computer monitor, dashboard view of an ERP software enterprise resource planning, or a CRM software customer relationship management, charts, data and reports, graphic interface (3d render)

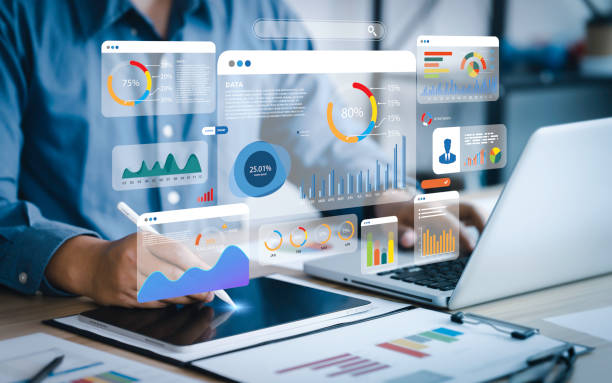
Two data analysts Working on data analysis dashboard for business strategy

Advisor financial business analytics woman team analyzing data charts, graphs, and a dashboard on laptop screen. Data analysis concept.


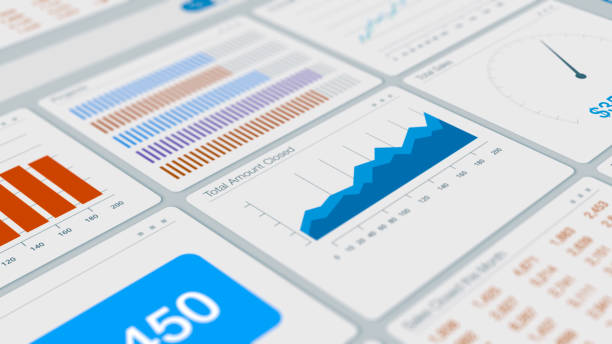
Dashboard ui. Statistic graphs, data charts and diagrams infographic template. User admin panel template design. Analytics dashboard.

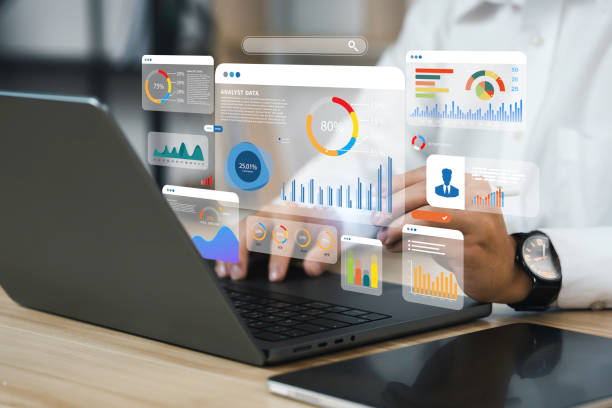
Business finance data analytics graph.Financial management technology.Advisor using KPI Dashboard on virtual screen


Advisor financial business analytics woman team analyzing data charts, graphs, and a dashboard on laptop screen. Data analysis concept.


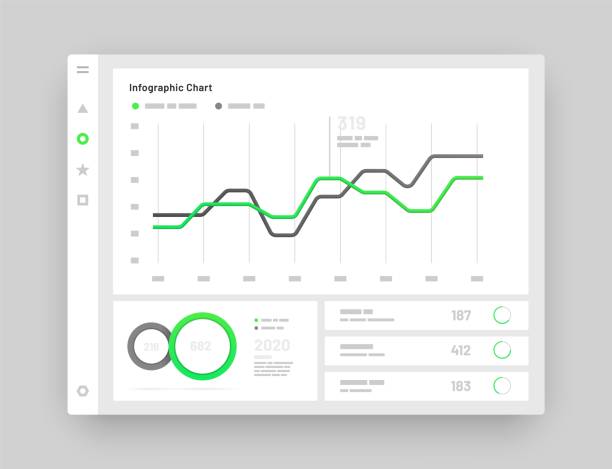
Web app Dashboard UI and UX Kit. Elements of infographics Use in presentation templates, mobile app and corporate report.

Web app Dashboard UI and UX Kit. Elements of infographics Use in presentation templates, mobile app and corporate report.


Employee profile dashboard. Advisor using Employee-KPI Dashboard on screen. HR Attrition,Employee retention, human resources Analytics and Engagement.CRM Customer Relationship Management.

Advisor using KPI Dashboard on virtual screen.Business finance data analytics graph.Financial management technology

Operator wearing a headset, using a dashboard on laptop for data analysis in modern office


Man look at the dashboard with graphs and charts. Concept of data management system, business intelligence, data statistics, marketing analysis, key performance indicators (KPI) and analytics.


Man look at the dashboard with graphs and charts. Concept of data management system, business intelligence, data statistics, marketing analysis, key performance indicators (KPI) and analytics.

Businessman using KPI dashboard.Management data System KPI connected in database for follow earnings,operations and sales data.Financial business data analytics graph dashboard


The analyst is using a computer and a dashboard for business data analysis. They are working with an information database to analyze marketing sales data
Vector set of 16 icons related to business and data management, analytic service and datasets. Mono line pictograms and infographics design elements - part 1


Analyst working on business Ai analytics dashboard with KPI, charts and metrics to analyze data and create insight reports for executives and strategical decisions. Operations and performance management.

A person interacts with a digital sales dashboard displaying various performance metrics and analytics.


Woman, online trading and phone call, finance with advice and computer screen, financial investment and communication. Headset, microphone and callcenter with laptop, agent at desk with stock market

Marketing vector business illustration in isometric design. Marketing e-commerce, data analysis tool.

A female analyst analyzes KPI Business Analytics Data Dashboard Management System on a computer


person analyzing data on laptop, focusing on various charts and graphs displayed on screen. setting suggests modern workspace, emphasizing productivity and technology.


User Experience Vector illustration of the infographic elements. Can be used for workflow layout, business step, banner, web design.
Vector set of 16 icons related to business management, strategy, career progress and business process. Mono line pictograms and infographics design elements - part 47

Call center, customer support and man with overlay on computer for telemarketing, service and crm network. Communication hologram, contact us and male with headset help, smile and consulting client

We are hiring and online recruitment concept with tiny people character suitable for landing page, template, mobile app, banner, template, vector illustration. template


A person interacts with a digital sales dashboard displaying various performance metrics and analytics


Web app Dashboard UI and UX Kit. Elements of infographics Use in presentation templates, mobile app and corporate report.


Business woman data analyst using technology AI for working tool for data analysis Chatbot Chat with AI, using technology smart robot AI, artificial intelligence to generate something or Help solve work problems.
Next