
Images
Exponential Graph Pictures, Images and Stock Photos
Browse 790+ exponential graph stock photos and images available, or search for exponential growth or exponential curve to find more great stock photos and pictures.
Most popular

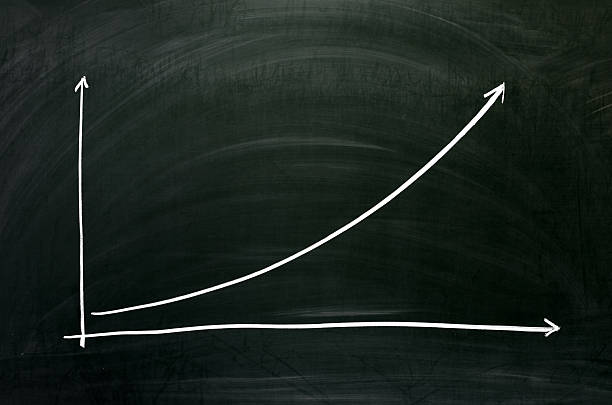
Close up of a businessman"u2019s hands drawing an exponential line curve showing of business growth and success rapidly.
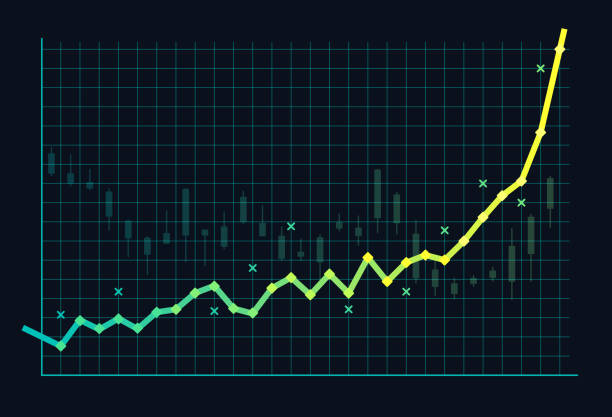
Stock market growth bubble spike exponential growth background concept.

Exponential function and linear function in a graph or chart isolated on a white background. Vector illustration of different types of growth – linear with a straight line and curved exponential, math concept.
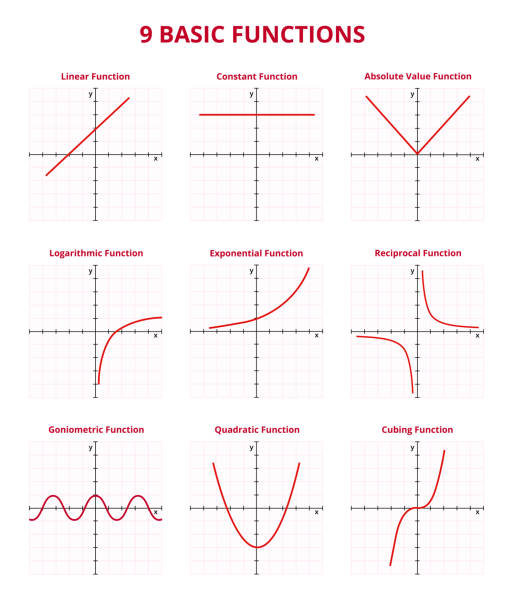
Vector set of graphs or charts with 9 basic mathematical functions with grid and coordinates isolated on a white background. Linear, constant, absolute value or modulus, logarithmic, exponential, reciprocal, goniometric or trigonometric, quadratic or polynomial, and cubing, cube, or cubic function.
Abstract growth graph chart with launch rocket on technology blue background. Startup and success business concept. Boost metaphor in futuristic light blue style. Low poly digital vector illustration.

Wooden Block Statistics Graph With Arrow Showing Exponential Growth Trend

Binary fission and the power of two. Cell division in biology, where a single cell produce 2 parts. Nuclear fission in physics, where an atomic nucleus splits into 2 nuclei, leading to chain reaction.
Hand-drawn vector drawing of a Growth Graph Arrow Symbol. Black-and-White sketch on a transparent background (.eps-file). Included files are EPS (v10) and Hi-Res JPG.

Rocket launch. Exponential growth chart from polygons. Technology fast growth. Business or finance, career concept. Digital space shuttle technology. Isolated vector illustration on white background.

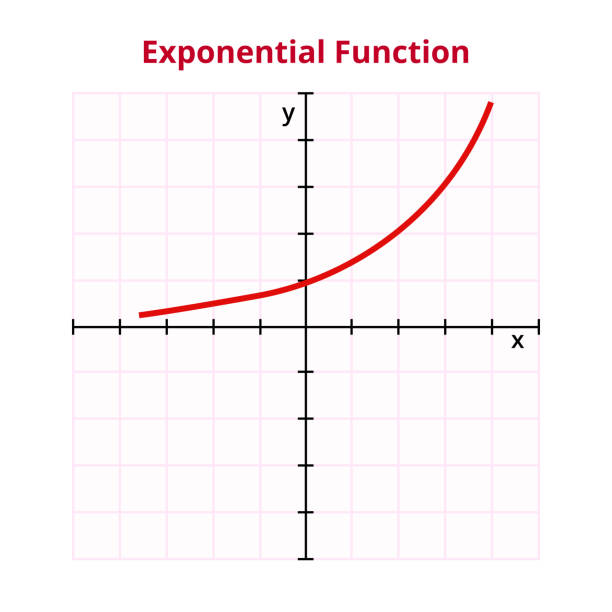
Vector graph or chart of exponential function with formula or equation f(x) = ax, or f(x) = exp x. The mathematical operation, basic function. Graph with grid and coordinates isolated on white.

Vector graph or chart with comparison of simple interest and compound interest isolated on a white background. The time dependence of the money value can be linear or exponential. Time is money.


exponential growth curve sketched with white chalk on blackboard, eraser smudge patterns
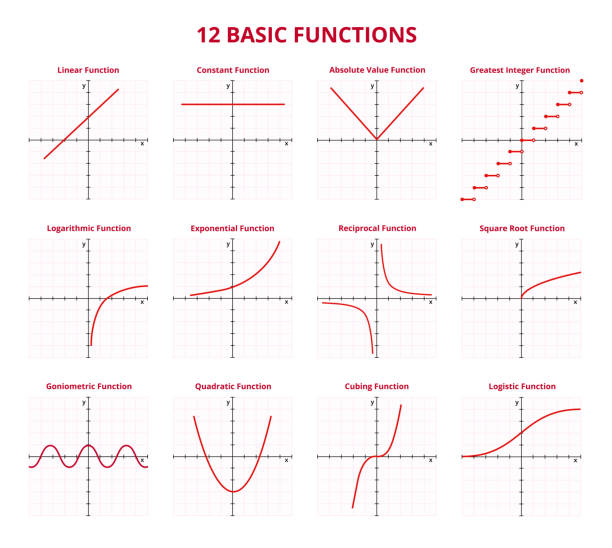
Vector set of graphs or charts with 12 basic mathematical functions with grid and coordinates. Linear, constant, absolute value, greatest integer, logarithmic, exponential, reciprocal, square root, goniometric, quadratic, cubing, logistic function. The functions are isolated on a white background.

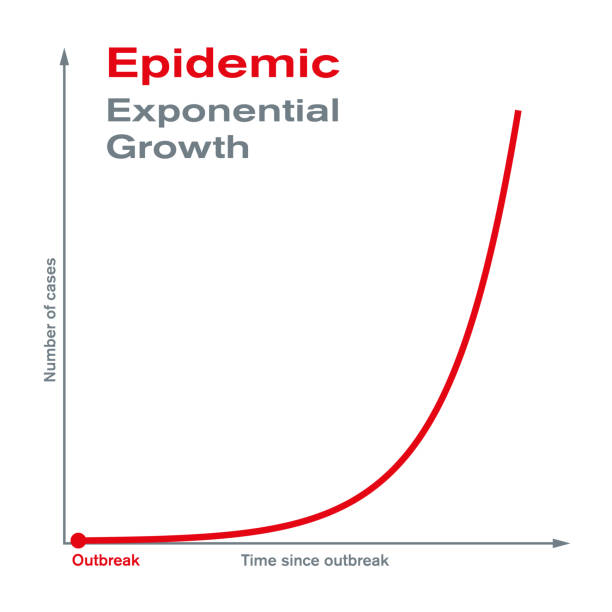
Epidemic. Exponential growth. Rapid spread and epidemic outbreak of a disease to a large number of people in a short period of time. The number of cases increases exponentially. Illustration. Vector.
Illustration with exponential growth chart and red arrow on dark black background. 3d illustration.
Exponential growth graph with increasing stacks of dollar coins and arrow. Top down view flat vector illustration. Concept of profitable investment, financial growth and business success

Exponential growth or compound interest 3D. Business sales, investment, wealth or earning rising up graph profit increase concept, financial report graph with exponential arrow from flying rocket 3D
Stock market commodity value growth bubble spike exponential growth background concept.


Wooden Block Statistics Graph With Arrow Showing Growth Trend

Green Business Exponential Growth concept. Ecological Financial Profit success. Copy space. 3D rendering.

exponential graph. growth development progress concept. arrow going up on black paper.

exponential growth curve explained on blackboard with books, rough white chalk sketch


Vector illustration of exponential function graph on a checkered sheet of paper. mathematic equation.

3d Business bar graph strategy concept. Business increase positive money financials, 3d rendering. Vector illustration

3D rendering of the exponential decay curve

Vector set of nine graphs or charts with isochoric, isobaric, and isothermal processes. Constant volume, pressure, and temperature. Physics, chemistry, thermodynamics. Linear and exponential graphs isolated.

The image presents a bar chart with an upward growth trend, set against a dark blue gradient background. Here are the key details: Visual Elements: Bar Chart Representation: The image consists of multiple vertical bars arranged from shortest on the left to tallest on the right. The bars are light blue and semi-transparent, with reflections underneath, adding a sleek, modern aesthetic. Each bar represents an increasing value, suggesting growth or improvement over time. Upward Curve (Trend Line): A smooth, white curved line starts from the bottom left corner, following an exponential growth pattern as it ascends toward the tallest bar on the right. The line ends with a glowing white dot at the peak of the last bar, signifying a highlighted achievement or key milestone. Background & Mood: The gradient dark blue background gives a professional and futuristic feel, often used in business, technology, or financial presentations. The absence of labels or numbers makes it a conceptual representation rather than a specific dataset. Possible Interpretations & Meaning: Business Growth – Increasing revenue, sales, or market share. SEO/Marketing Success – Improving website traffic or ranking over time. Financial Performance – A rising stock price or investment returns. Technological Advancements – Growth in AI, innovation, or data analytics. This image is highly symbolic of success, progress, and positive momentum, making it ideal for presentations, reports, or infographics related to business, finance, or digital marketing trends.


Wood textured graph bars following an exponential growth over a white wood background

Statistics set icon. Working reports. Documents, diagram, pie and bar chart, flipchart, visual aid, survey. Business concept. Glassmorphism style. Vector line icon for Business and Advertising.


3D rendering of the exponential growth curve
Assignment target icon. Clipboard, checklist symbol. 3d vector illustration. Project task management and effective time planning tools. Project development icon. 3d vector illustration. Work organizer

Available in high-resolution and several sizes to fit the needs of your project.

Royalty free 3d rendering of exponentially rising graph.
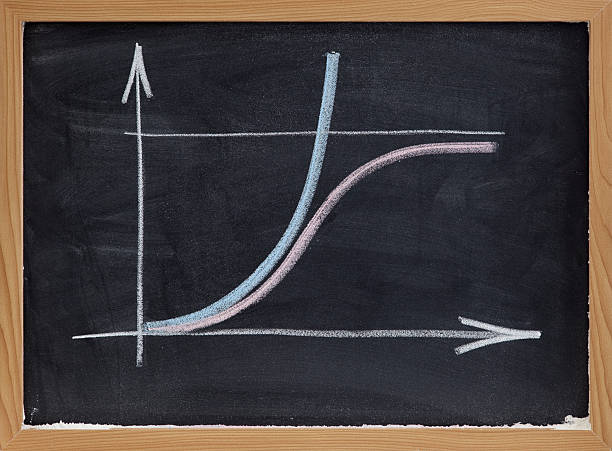
two growth curves, exponential and s-shape corresponding to limited resources, chalk sketch on blackboard
Increase productivity, manufacturing analyse, capacity process, efficient grow premium icons pack. line signs arrow up, gears and people. Vector icons set for web and app in outline editable stroke.


Future trend presented with exponential growth chart diagram, world map and year 2020 to 2030 numbers in blue color on white background. 3d illustration.

Stock market commodity value growth bubble spike exponential growth background concept.

Businessman drawing an exponential curve of a progress in business growth performance, return on investment - ROI, on a virtual screen presentation.

Illustration with mathematical exponential growth chart and red arrow pointing up on dark black background over reflective surface. 3d illustration.

Bar graph with ascending three dimensional bars in rust orange color over empty blank beige sunburst backgrounds with copy space for text. Ideal for business growth, rise or increase, showing an upward trend.
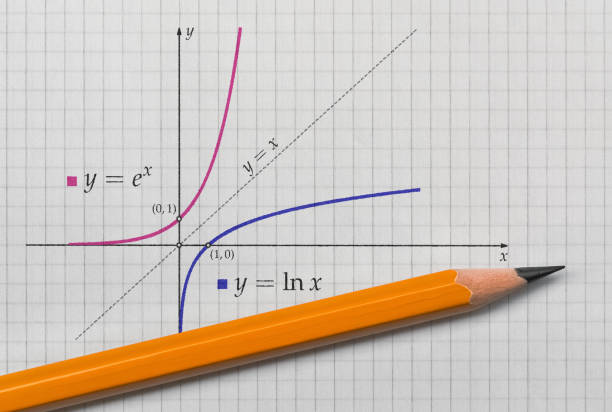
Exponential and natural logarithmic function plotted on bright background
Next