00:13
Browse 4,200+ inflation-graph stock videos and clips available to use in your projects, or start a new search to explore more stock footage and b-roll video clips.
Stock Market and Exchange, Exchange Rate, Exchanging, Graph, Data

Digitally generated animation with copy space, seamlessly loopable. Perfectly usable for all kinds of topics related to financial technology, business and economy, user statistics or data science.

Income cash growing chart, digital animation
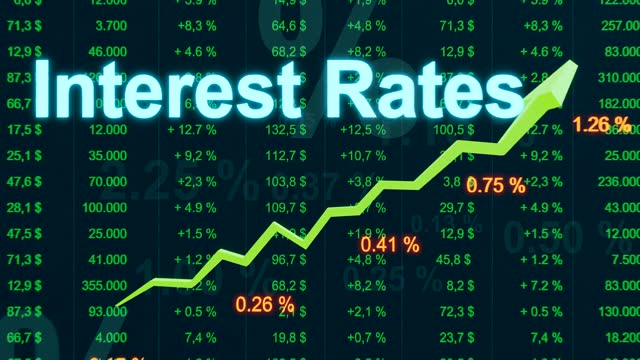
High Inflation rate. Economic Depression. Chart rises to increase in inflation rates. Diagram with percentage signs.

Digitally generated animation with copy space, seamlessly loopable. Perfectly usable for all kinds of topics related to financial technology, business and economy, user statistics or data science.
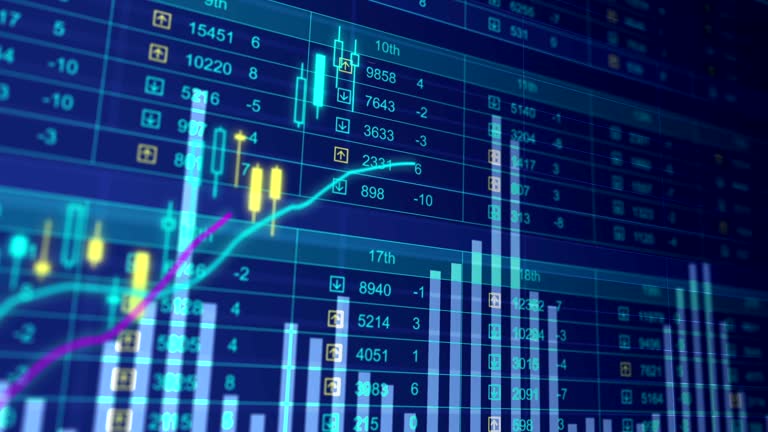
Electronic chart showing stock market fluctuations

3d rendered financial graphs, symbolizing losses and negative market conditions. Seamlessly loopable. Perfectly usable for topics like stock exchange, financial technology or business and economy in general.

Container, Commercial Dock, Stock Market Data, Moving Up, Analyzing
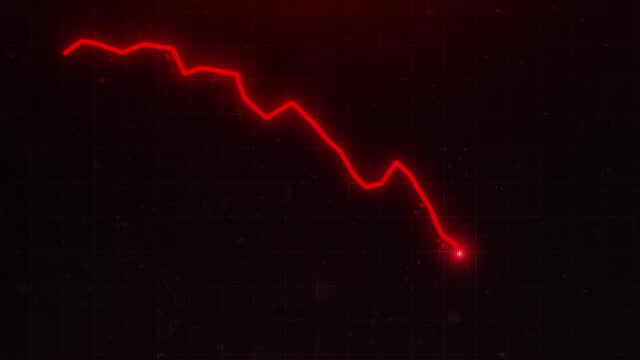
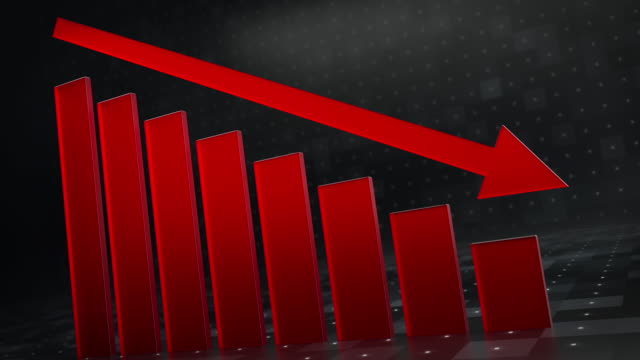
Red graph going down into recession. Stock Market Crash Background Animation. Downtrend. Financial failure, economic crisis concept. Stock chart fall. Downward trend, business crash and economic collapse. Declining stats, default
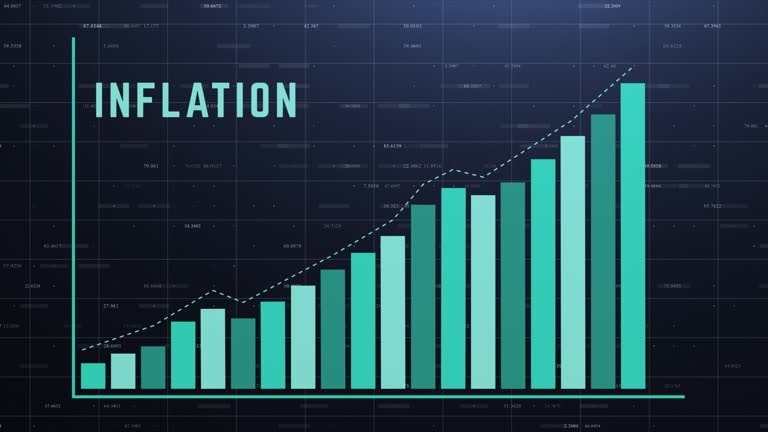
Digital animated background of bar chart representing inflation growth on trading board screen with abstract stock quotes or binary code. Upward economic recession concept. Animation

urban skyline timelapse with Business data Analytics dashboard Technology Overlay, Futuristic Design for Financial and business concepts

3d rendered financial graphs, symbolizing success and positive market conditions. Seamlessly Loopable. Perfectly usable for topics like stock exchange, financial technology or business and economy in general.

Man Using a Laptop with Business data Analytics dashboard animated overlays

Endless stock exchange market chart animation. 4K, ProRes loopable.

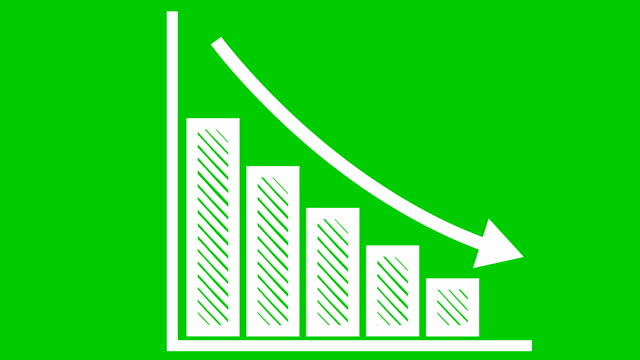
Financial graph showing statistics, prices falling, stock market crash, crisis, inflation rate. Electronic chart with stock market fluctuations abstract concept.

Growing chart and financial figures with growth demand annual report for real estate for property developers. Growth bar with stock market indexes and prices for financial securities. Inflation data.
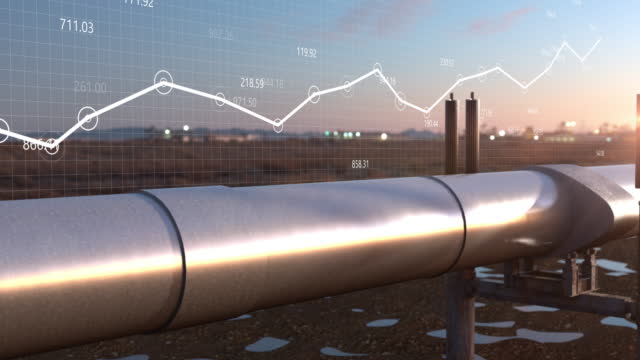
Gas oil pipeline on a background of the financial growing up chart. 3d animation of the crude fuel transportation delivery to resources customers. Economic crisis, inflation and rising energy prices.

Financial graph showing statistics, prices falling, stock market crash, crisis, inflation rate. Electronic chart with stock market fluctuations abstract concept.

Hologram, coins and finance with inflation, economy and investment with increase, profit growth and prices. Empty, money and arrows with trading, currency and earnings with stock market value or data

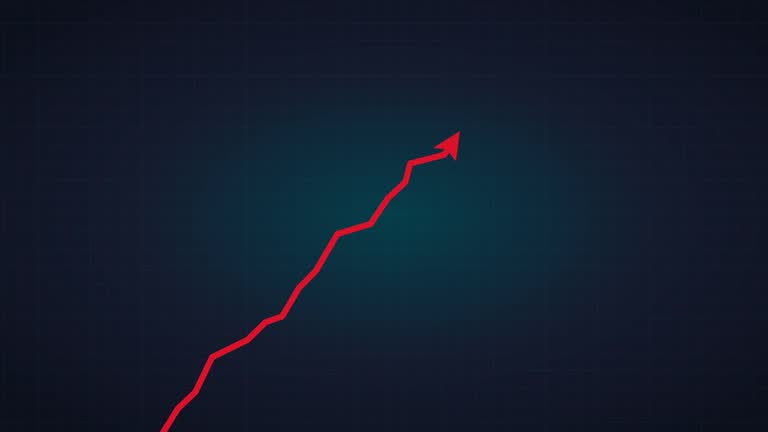
The graph of a declining red line could symbolize many things like a financial crash, breakdown or major crisis

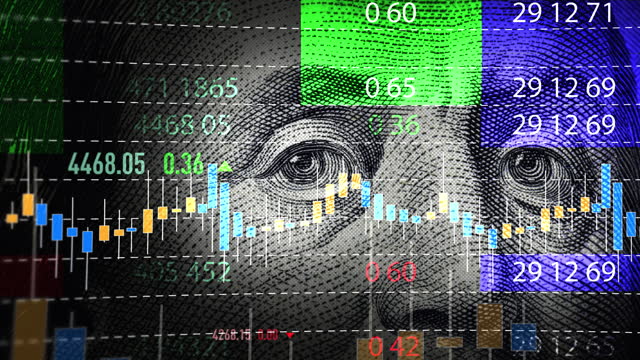
Business chart and graph with 100 Dollar money count in background. Seamless and loopable animation. Abstract concept of economy, finance, investment, trading market and financial data.

Stock Market Data, Moving Up, Analyzing, Growth, Rising

3d rendered financial graphs, emerging and constantly changing. Seamlessly Loopable. Perfectly usable for topics like stock exchange, financial technology or business and economy in general.

In the reflection of glasses on a female face, surfing the Internet and making money with growing columns of coins and up arrows. Inflation and rising prices. Cash. Cg footage

Inflation recession and depression crisis charts and graphs diagram with man typing computer keyboard. Digital analysis and report on 3d screen display.

Housing market inflation rising graph 2D animation. Property mortgage rates. Real estate price chart 4K video motion graphic. Home price growth color animated cartoon flat concept, white background
Bond market, interest rates and rising mortgage rates concept. 3D animation

Downward trend, falling chart on 100 dollar bills, recession concept

Green energy in full development.Increase in electricity prices on the world market
Fall Down Modern Red Graph Bar. Abstract Illustration Plummeting Business 3d Animation. Bad Loss Finance Concept Background. Close-up Chart of Corporate Company Falling Income After Covid-19 Pandemic

Global economy, a large group of people with graphs overlay.

Cash dollars rising step by step in bundles on black background. The earnings of new billionaires have been increasing rapidly in recent years.

The fall and rise of stocks on the stock exchange. Trading.

American dollar rise, fall. World exchange market. Currency rate fluctuating 4k animation.

Rising crude oil price, chart and oil barrels. Commodity oil chart moving up, investment, brent crude oil, energy crisis, trading, supply and demand, business.

Gold ingots and Dollar banknotes moving up step by step on white background.

Business data Analytics dashboard Technology animated overlays, Futuristic Design for Financial technology and business concepts

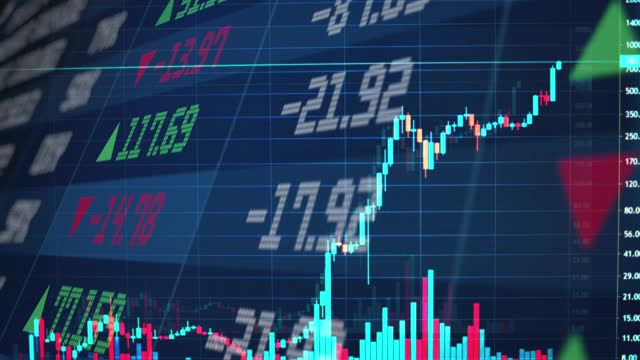
Motion Animation of a Stock Exchange Market. Financial Business Graph. Online exchange trading. Currency trading. 3d chart and indicators change. Profits and losses in trading of securities.

Financial graph showing statistics, prices falling, stock market crash, crisis, inflation rate. Electronic chart with stock market fluctuations abstract concept.

Bars made of 50 Euro bills falling and rising. Clean render on a white background.

Newspaper Headline: Inflation headline printing on economy and business newspapers concept.

Dive into the financial world! Watch the drama unfold on a black monitor as candlestick graphs trace a downtrend in the stock market. The numbers tell a story of market movements. Stay informed as the chart evolves in this dynamic financial display.

Dive into the world of crypto trading! Get up close with a cryptocurrency exchange as online candles flicker on the device screen. Follow the market rhythm and explore the exciting dynamics of digital currencies.

Gold ingots rising step by step with green arrow on black background. The earnings of new billionaires have been increasing rapidly in recent years.

Bitcoin price chart fell sharply and volatile. Investors stock sell huge losses
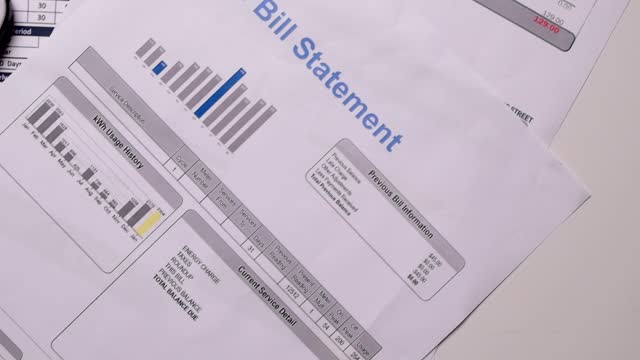
Home electricity expenses and bill statement document

Money Graph Or Salary Chart. Financial Investment