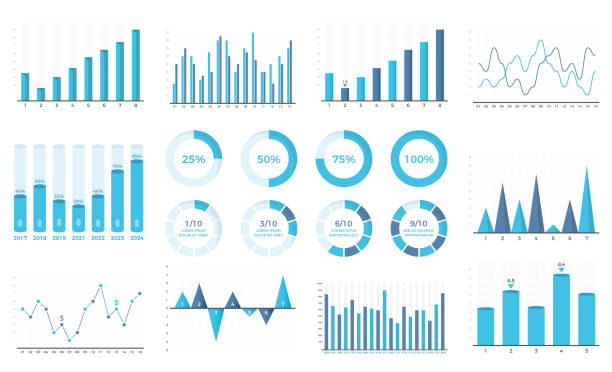
Set of bar graphs and line charts, circle progress indicators, vector eps10 illustration
Browse 4,700+ histogram chart stock illustrations and vector graphics available royalty-free, or start a new search to explore more great stock images and vector art.
Set of bar graphs and line charts, circle progress indicators, vector eps10 illustration

Line graph. Linear chart growth, business diagram graphs and colorful histogram graph or business currency stock financial graphics. Investment planning analysis isolated vector symbols set
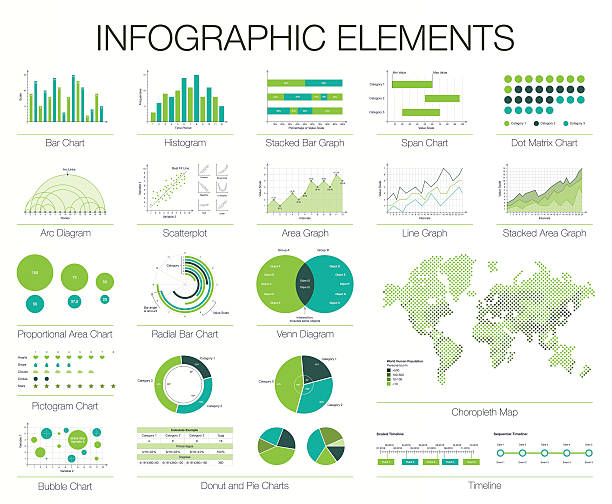
Infographics Template. Set of graphic design elements, histogram, arc and venn diagram, timeline, radial bar, pie charts, area, line graph. Vector choropleth world map

Graph chart. Financial statistic infographic template, stock and business histogram, financial modern analysis layout. Vector isolated set. Illustration of financial line analysis, finance histogram
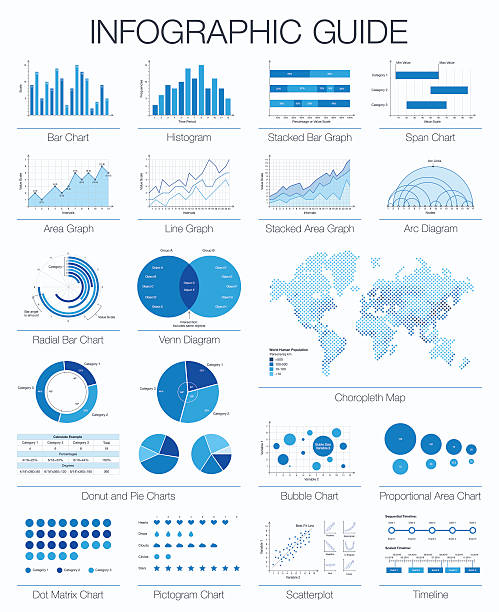
Useful infographic guide. Set of graphic design elements, histogram, arc and venn diagram, timeline, radial bar, pie charts, area, line graph. Vector choropleth world map
Graph line icons. Vector illustration include icon - data analysis, diagram, stat, histogram, economy outline pictogram for infographic statistic presentation. Green Color, Editable Stroke.

Bar graph and line graph templates, business infographics, vector eps10 illustration
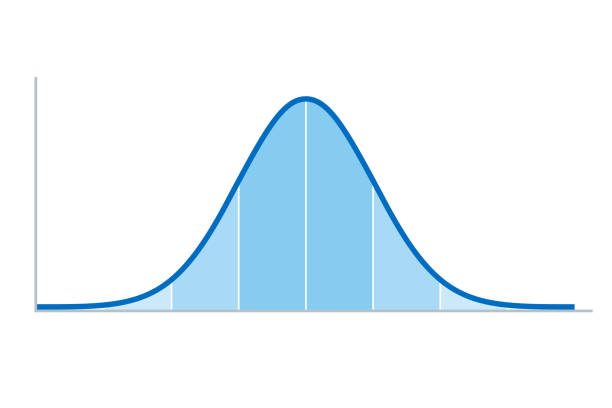
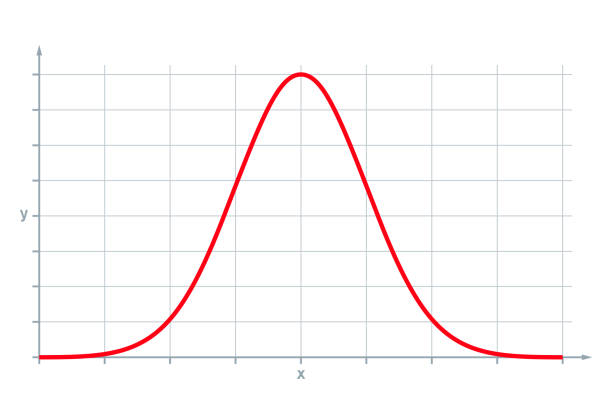
Gaussian distribution. Standard normal distribution, sometimes informally called a bell curve, used in probability theory and statistics. Standard deviation. Illustration on white background. Vector.

Normal distribution, also Gaussian distribution or Bell curve. Very common in probability theory. The red curve shows the standard normal distribution. Illustration on white background.

Company marketing analytics presentation vector illustration template bundle. Amazing business data vertical bar chart design layout. Colorful 3D balls corporate statistics infographic elements set.
Graph icon set. Illustrator 10 vector image.
This image is a vector illustration and can be scaled to any size without loss of resolution, can be variated and used for different compositions. This image is an .eps file and you will need a vector editor to use this file, such as Adobe Illustrator.

Illustration and Painting

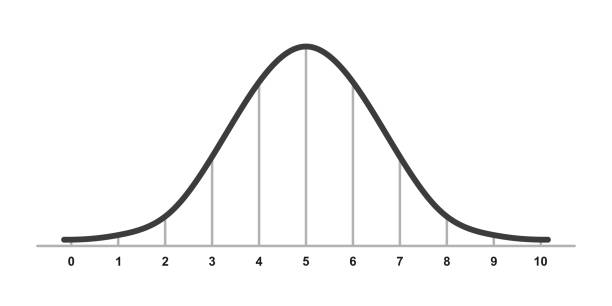
Bell curve graph. Normal or Gaussian distribution template. Probability theory mathematical function. Statistics or logistic data diagram isolated on white background. Vector graphic illustration

Graphs, charts isometric vector illustrations set. Business infographic elements pack. Financial diagrams, infocharts, statistical data analysis visualization. Report, presentation 3d cliparts

Statistics. Flat vector infographic with graphs and charts elements on devices screens. Finance statistics report, business statistics, mobile app ui kit, modern tehnology. Analytics process concept

Bar graph and line graph templates, business infographics, vector eps10 illustration

modern vector abstract bar chart infographic elements.can be used for workflow layout, diagram, number options, web design. illustration ,EPS10

Vector scientific graph or chart with a continuous probability distribution. Normal distribution or Gaussian distribution, diagram with percentages and standard deviations isolated on a white background.
Diagram and Graph icons. Flat design collection 56. For presentation, graphic design, mobile application, web design, infographics. Vector illustration.
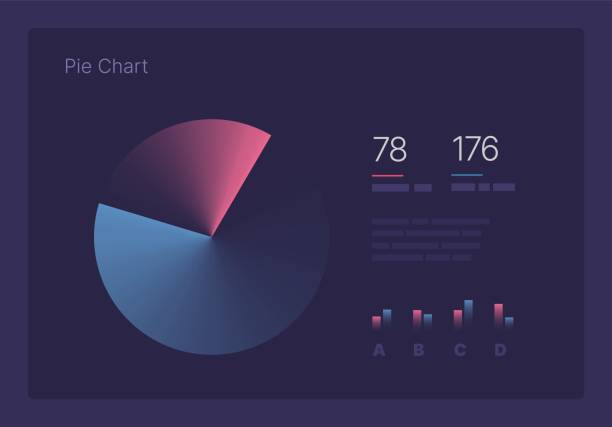
Infographic charts for business layout, presentation template and finance report. Data visualization with Pie Chart.

modern vector abstract bar chart infographic elements.can be used for workflow layout, diagram, number options, web design. illustration ,EPS10
Graph line icons. Vector illustration include icon - data analysis, diagram, stat, histogram, economy outline pictogram for infographic statistic presentation. 64x64 Pixel Perfect, Editable Stroke.

Template for advertising brochure with business people on spiral work flow

Vector black and white line scientific graph or chart with normal or Gaussian distribution. Continuous probability distribution diagram with percentages and standard deviations isolated on a white background.

Gaus chart with different height columns. Normal distribution graph. Bell shaped curve template for statistics or logistic data. Probability theory math function. Vector flat illustration
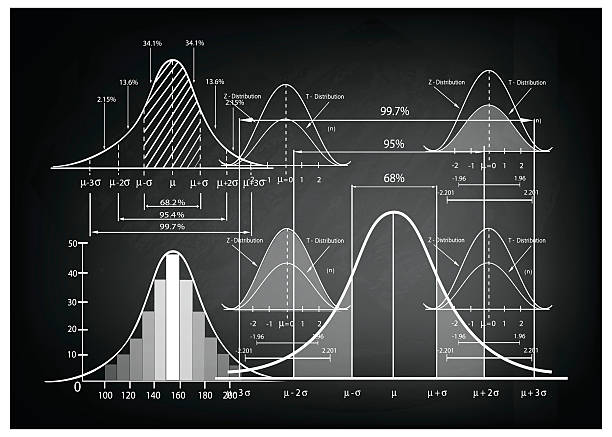
Business and Marketing Concepts, Illustration of Standard Deviation Diagram, Gaussian Bell or Normal Distribution Curve Population Pyramid Chart for Sample Size Determination.
Gauss distribution. Standard normal distribution. Gaussian bell graph curve. Business and marketing concept. Math probability theory. Editable stroke. Vector illustration isolated on white background.
Business and Marketing Concepts, Illustration of Standard Deviation Diagram, Gaussian Bell or Normal Distribution Curve Population Pyramid Chart for Sample Size Determination.

Illustration and Painting

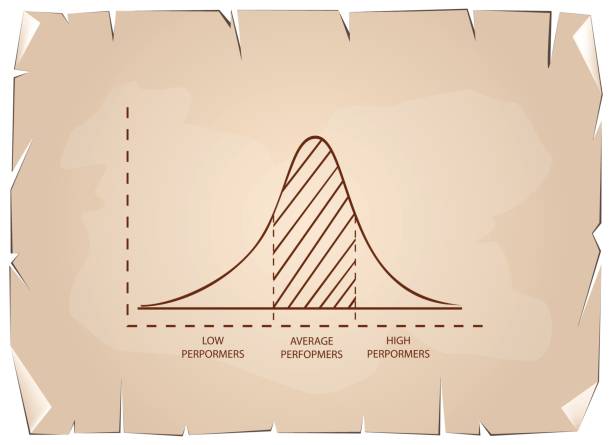
The standard deviation, sometimes called bell curve, describes the amount of variation in a data set by measuring and averaging, how much each value in the data set varies from the calculated mean.

Gauss distribution. Standard normal distribution. Distribution standard gaussian chart. Vector illustration isolated on white background.
Standard normal distribution, also Gaussian distribution or bell curve. Used in statistics and in natural and social sciences to represent real-valued random variables of unknown distributions. Vector

Business statistics and big data marketing analysis infographics banner background EPS 10 JPG JPEG vector illustration
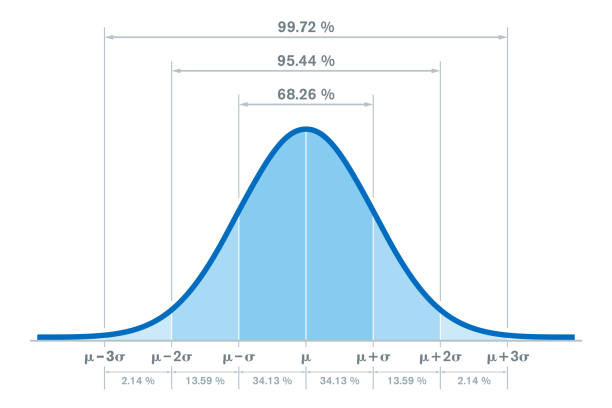
Standard normal distribution, with the percentages for three standard deviations of the mean. Sometimes informally called bell curve. Used in probability theory and in statistics. Illustration. Vector

Illustration and Painting
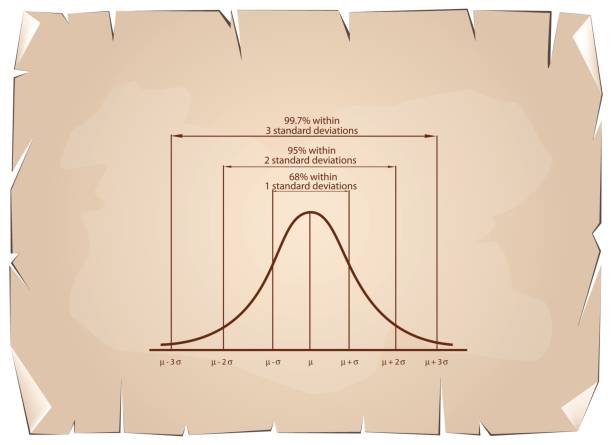
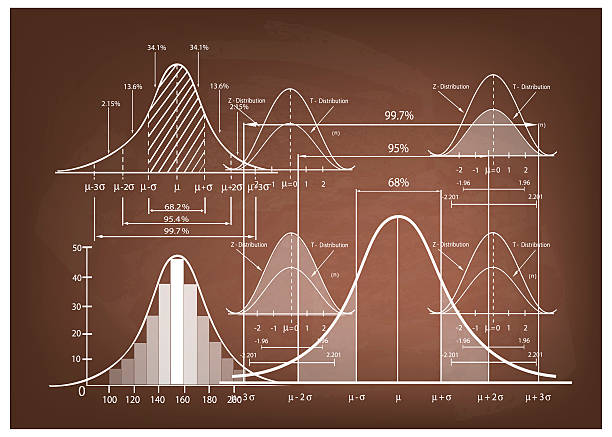
Business and Marketing Concepts, Illustration of Standard Deviation Diagram, Gaussian Bell or Normal Distribution Curve on Old Antique Vintage Grunge Paper Texture Background.

Financial graph with a linear diagram, a histogram in the stock market. Abstract vector background
Ascendant bars graphic icon with rising arrow. Histogram icon in black. Infographic. Chart icon. Upward graph arrow chart vector flat, grow, gain, improvement, bar, diagram

Illustration and Painting
Success as growth line. Growing bars graphic with rising arrow. Growing graph icon in black. Bar chart. Infographic. The concept of your capital growth or forecasting analysis algorithm
Business and Marketing Concepts, Illustration of Standard Deviation, Gaussian Bell or Normal Distribution Curve on Old Antique Vintage Grunge Paper Texture Background.
Vector color flat chart diagram icon illustration set. Red and blue diagram collection of pie, donut, radial bar and histogram infographic element. Design for finance, statistics, analytics, science.
Graphic icon set. Bussines infographic illustration symbol. Sign chart up vector flat.

Isometric infographic elements. 3d graphs, bar chart, market histogram and layer diagram. Business presentation vector infographics. Illustration of chart 3d flat, graph design information

Business and Marketing Concepts, Illustration of Standard Deviation Diagram, Gaussian Bell or Normal Distribution Curve Isolated on White Background.

Underexposure, Correct Exposure and Overexposure Photos and Histogram Graphs with CSC Cameras, ISO, Shutter Speed and Aperture Icons.

Bar graph and line graph templates, business infographics, vector eps10 illustration