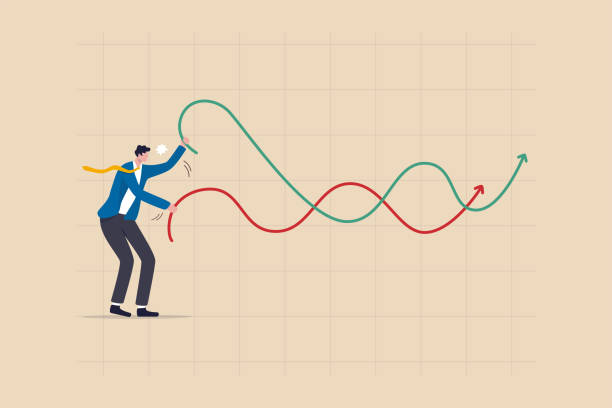
Financial investment volatility, up and down arrows profit graph due to Coronavirus crisis, businessman trying to balance like a tightrope walker so that volatility does not gobble up his investments
Browse 5,200+ volatile stock illustrations and vector graphics available royalty-free, or search for volatile market or volatile stocks to find more great stock images and vector art.
Financial investment volatility, up and down arrows profit graph due to Coronavirus crisis, businessman trying to balance like a tightrope walker so that volatility does not gobble up his investments

Chart financial asset movement abstract lines background design with space for your copy.

Bull bear market stock trade design. Bullish forex bearish market broker trend economic background

Volatility symbol with a graph in a specific period of time and a percentage symbol. Easy to use for your website or presentation.
market volatility chart for stock trading, cryptocurrency background. the up and down chart illustration on the blue theme screen.

isometric vector image on a blue background, a red arrow going up and blue down, success or failure in business
Containing data, web statistics, survey, prediction, presentation, cloud analysis and pie chart icons.
Line icons about stock markets. Contains such icons as high frequency trading, volatility, technical analysis and more. Editable vector stroke. 256 Pixel Perfect scalable to 128px...

a diagram chart of the stock trading market volatility. a collection for information, data visualization, presentation. an illustration for market updates.

Stock brokers hands keeping track of the Japanese candlestick chart in trendy vintage halftone collage style. Online trading concept. Financial market. Traders and stock brokers. Vector illustration

Close-up stock market candle stick chart with moving averages. Business, trading, investment and banking concept.

Business Plan, Analyzing, Business, World economy, Stock market, Recession, Forecasting

Stock market trading technical analysis bar chart fall. Business exchange graph downtrend. Crisis economy and investment loss graph. Trader financial index crash concept. Eps banner dark background

Trading of stock Chart blue technology Background template. trade Chart of forex, cryptocurrency, stock market and Binary option with Candles and indicators.
Return of investment icon. Financial plan and stock market trends line pictogram. ROI, personal and corporate investment, income planning and market volatility illustration. Editable stroke vector illustration

Investment challenges. Business or career challenges. Confronting the peak of the profit point."nStock market, crypto currency market. Investment risk. businessman surfing giant waves.

3D Isometric Flat Vector Conceptual Illustration of Investing In A Volatile Market, Risky Stock Business

Stroke medical condition with fast response and types outline diagram. Labeled educational scheme with brain blood supply problem and ischemic, transient or hemorrhagic examples vector illustration.

Stock market chart, lines and data. Cloes-up orange and blue candle stick chart, lines and moving averages in defocus. Business, trading, investment, growth.

Stock market changes and fluctuations vector concept. Markets plummet and skyrocket, soar. Market analysis symbol, trading and forecast. Eps10 illustration.

concept of volatility stock market investment. percentage and arrows up and down in continuous line drawing vector illustration
A set of icons illustrating the highs and lows of the stock market. They include editable strokes or outlines using the EPS vector file. The icons include a upwards graph indicating the stock market going up, stock market crash, fingers crossed, investor excited that stock prices going up, bag full of money, losses in the stock market, piggy bank being shaken upside down, person depressed from loosing money in the stock market, bear market, bull market, global stock market, money being funneled down, depressed business person, hand holding smartphone with the word sell on the screen, hand holding smartphone with the word buy on the screen, person desperately reaching for money, calculator with financial chart, investment goal and a business person holding an upwards arrow to name a few.
Stock Market Concept Basic Two Color Line Icon Set with Editable Stroke. Icons are Suitable for Web Page, Mobile App, UI, UX and GUI design.
Stock Market Concept Basic Solid and Line Icon Set with Editable Stroke. Icons are Suitable for Web Page, Mobile App, UI, UX and GUI design.

Chart moving up and down, volatile market. Stock market and exchange. Business, investment, wealth, research, data.

Stock market chart, lines and data. Cloes-up orange and blue candle stick chart, lines and moving averages in defocus. Business, trading, investment, growth.

Sevoflurane, fluoromethyl molecule. It is inhalation anaesthetic, used for the general anesthesia. Molecular model. 3D rendering. Illustration

Uncertainty ahead volatility financial hardship recession approaching danger abstract background design.
Volatility on financial market, blue finance background from columns, candlesticks, line, arrow. Financial market concept

VUCA acronym concept of volatility, uncertainty, complexity and ambiguity vector illustration with keywords and icons
Stock Market Concept Basic Thin Line Icon Set with Editable Stroke. Icons are Suitable for Web Page, Mobile App, UI, UX and GUI design.
Investment icons set in line design. Business, Finance, Wealth, Growth, Income, Money, Investor, Portfolio, Risk, Inflation, Bond, Interest, Strategy, vector illustrations. Editable stroke icons.

Chart with rising and falling line. Positive and negative business. Stock market data, financial figures, downgrade, upgrade, investment, finance and industry.

Courage and leadership to success business, investment volatility metaphor, financial stock market fluctuation rising up and falling down concept, investors standing in paper boat on fluctuated market chart
coins stack with flowing growth chart arrows wealth saving and investment concept continuous one line vector illustration

Forex candlestick pattern. Trading chart concept. Financial market chart. Volatility word

Dollar Cost Averaging Concept - DCA - Person Looking at Financial Graph and Investing the Same Amount of Money as Time Goes By - 3D Illustration

3D Isometric Flat Vector Conceptual Illustration of Market Control, Stock Exchange Market

A 3D illustration showing a green bull and red bear on rising and falling platforms, symbolizing stock market trends