
Images
Browse 950+ curve line graph stock photos and images available, or start a new search to explore more stock photos and images.
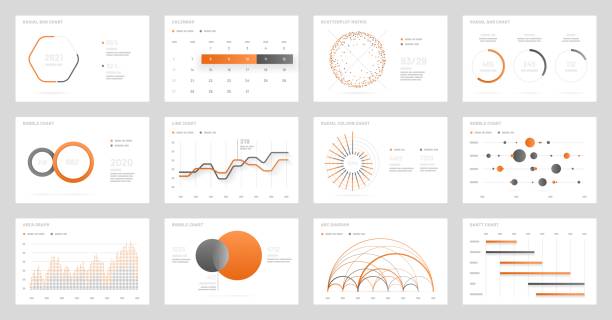
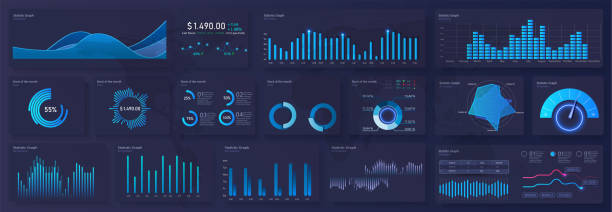
Big set of infographic tools. Use in presentation templates, mobile app and corporate report. Dashboard UI with big data visualization.
Modern background design with abstract graphs and textures. Fully editable vector.
Vector flat chart area graph simple illustration set. Black curve line graphic icons isolated on white background. Concept of finance statistics, analytics. Design element for ui, report, web.
Our creative library is free of AI-generated contentChoose your visuals with confidence knowing our creative library is free from AI-generated content, so your searches only return safe, high-quality visuals you can trust.
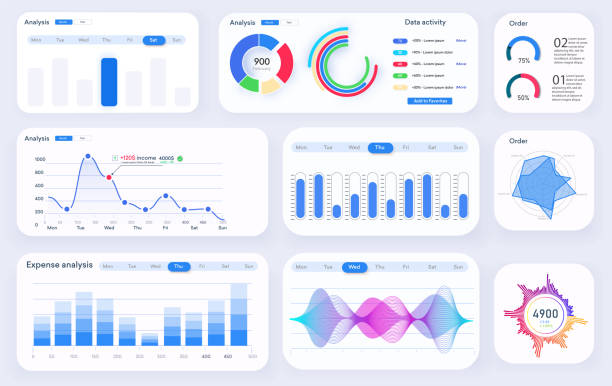
Web dashboard, great design for any site purposes. Business infographic template. Vector flat illustration. Dashboard user admin panel template design.
Modern background design with abstract graphs and textures. Fully editable vector.
3D digital colored wireframe landscape on white background. Sound waves abstract visualization. Concept of big data charts analysis and information technology. Vector illustration of sound waves flow.

Modern financial background design with bule and pink abstract graphs and textures.
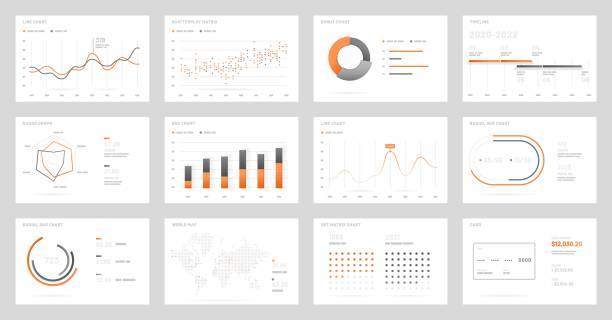
Modern modern infographic vector template with statistics graphs and finance charts. Diagram template and chart graph, graphic information visualization

Line charts slide template. Business data. Graph, diagram. Creative concept for infographic, report. Can be used for topics like economics, analysis, research

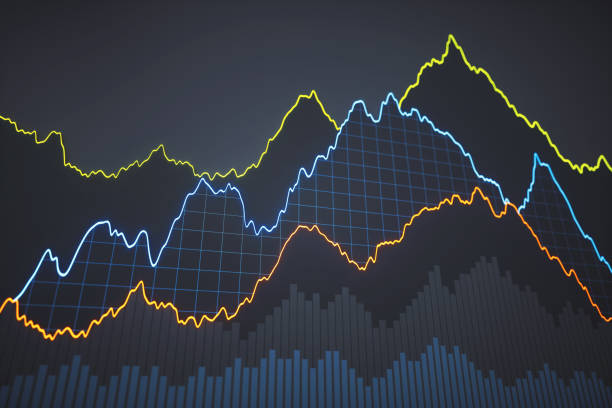
Graph stock market. Stock indices. For trading concept. Vector illustration.

Three arrow head chart lines moving upwards to one direction on blue background
NOTE FOR REVIEWERS: This image is a 3D render and does NOT have a corresponding vector file

Digitally generated image, perfectly usable for all kinds of topics related to financial technology, business and economy, user statistics or data science.

Admin dashboard charts. Infographic web page, data graphic UI,UX, KIT screen cards and statistic chart diagrams.


Modern business background design with abstract graphs, textures and stock candles. Stock Exchange growth concept.

Abstract Finance Technology Concept - 3d rendered image. Fintech background. Analyzing Digital Data, Statistics, Financial Chart, Economy, Stock market idea. Financial technology graph with trends lines.
Big set of infographic tools. Use in presentation templates, mobile app and corporate report. Dashboard UI with big data visualization.


Abstract image featuring wavy lines creating a digital landscape. Perfect for themes related to technology, data visualization, and modern digital art. 3d illustration.


Modern business background design with abstract graphs, textures and big arrow. Financial growth concept.
Up arrow stock commodity stock market financial data cryptocurrency financial analysis abstract chart increase icon symbol design element.

Digitally Generated Image Of A Stock Market Bar Graph Trading With Pie Chart
Simple gradient color icons isolated over dark background related to graphs, diagrams and charts. Vector signs and symbols collections for website and app.
Vector illustration of a collection of ink and pencil drawing arrow symbols. Cut out design elements for user interface designs, business and marketing and presentations, teamwork and brainstorming, planning and forecasting, customer focuses, lifestyles and design projects in general.
Vector illustration of a collection of ink and pencil drawing arrow symbols. Cut out design elements for user interface designs, business and marketing and presentations, teamwork and brainstorming, planning and forecasting, customer focuses, lifestyles and design projects in general.

Modern financial background design with colorful abstract graphs and textures.

Four arrow head chart lines moving upwards on blue background.

3D illustration of a digital terrain made of layered blue waves and data lines, symbolizing technology, big data, AI, and virtual landscapes. Ideal for backgrounds, financial analysis, and modern tech concepts.
Set of chart and diagram small line vector icons. Editable stroke.

Line charts slide template. Business data. Graph, diagram. Creative concept for infographic, report. Can be used for topics like economics, analysis, research

Abstract Data Chart - 3d rendered image. Machine learning concept. Analyzing Digital Data idea. Big data graph representation with flowing data blocks.
abstract financial background,stock market or forex trading graph,finance graphs illustration template.

Financial business stock market abstract background

A line graph with a decreasing trend is commonly used to depict scenarios like declining sales, decreasing stock prices, or any situation where a decrease in values over time or across categories is a significant aspect of the data. It provides a clear and intuitive way to understand trends and make informed interpretations about the decreasing values being represented.


Abstract Finance Technology Concept - 3d rendered image. Fintech background. Analyzing Digital Data, Statistics, Financial Chart, Economy, Stock market idea. Financial technology graph with trends lines.

Abstract Finance Technology Concept - 3d rendered image. Fintech background. Analyzing Digital Data, Statistics, Financial Chart, Economy, Stock market idea. Financial technology graph with trends lines.

Abstract image featuring wavy lines creating a digital landscape. Perfect for themes related to technology, data visualization, and modern digital art. 3d illustration.


Modern background design with abstract graphs and textures. Fully editable vector.

Unified strength to bend the line graph. More Concept Series Lightbox


Modern financial background design with colourful abstract arrow graphs rising and textures. Business growth.

EKG Heart Monitor. PDF file is included.


of16Next